
This is a story that explores the complex history of New York City’s drinking watershed. The story begins in geologic time, and ends where we are today.
Timeline / Table of Contents
Key Underlined text: available content Regular text: future content scheduled for release
550 Million Years Ago
The landscape takes form
9000 BC
Native Americans inhabit the land
1830s
Water system construction begins
A Story About the NYC Drinking Watershed
Introduction
June 29, 2020
The US is experiencing not only a substantial economic and public health crisis related to Covid-19 but an underlying public water crisis. Millions of people face obstacles to access safe, clean running water daily. Agricultural runoff, byproducts of disinfection agents, as well as aging infrastructure like lead pipes have contaminated drinking water, especially in minority and low-income communities. In 2014, the city of Detroit began disconnecting residents’ water as part of a debt-collection program, and has since disconnected over 141,000 households in an act that the United Nations deemed a human rights violation. Infrastructure repairs, environmental clean-ups, and water privatization have all led to higher costs for individuals. While the cost for water has been rising around the US, the billion-dollar bottled water industry continues to use public water sources at unimaginably low costs for their products. (The Guardian, June 23, 2020)
Last month, additional EPA regulations were rolled back, this time Section 401 of the Clean Water Act. Section 401 gives states and First Nations veto power over industry projects that would impact local populations. These rollbacks make it easier for industries to frack, mine, and build pipelines in sensitive areas. This will affect land, air, and water, creating additional environmental sacrificial zones (mining and fracking have been found to heighten drinking water contamination risk from toxins like benzene, diesel, heavy metal pollution, cyanide and sulphuric acid to name some).
New York and surrounding states have used Section 401 to protect residential drinking water numerous times, including by creating high profile projects like the Constitution Pipeline and the Northeast Supply Enhancement Pipeline. Addressing environmental, health, and economic conditions in and around New York City’s watershed is a vital precondition for the creation of a more just present and future for urban and rural New Yorkers.
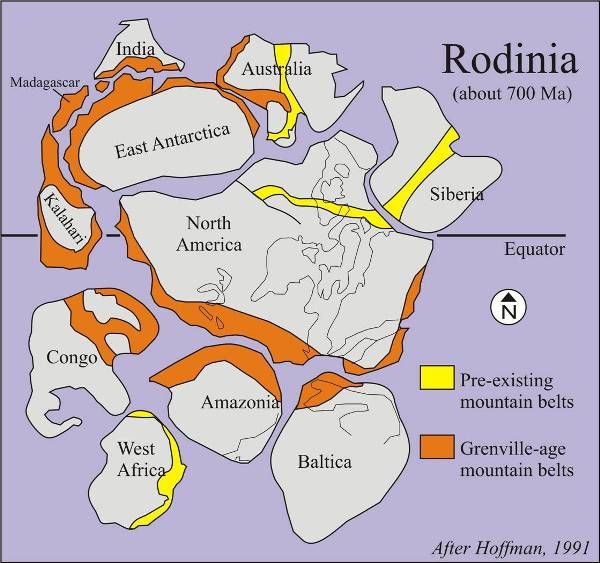
The Manhattan Prong
The Manhattan Prong was formed approximately 550 million years ago and extended all the way to southwest Connecticut (from the Algonquian Quinnitukqut meaning “at the long tidal river”). Its formation consisted of rolling hills and valleys, controlled by the underlying bedrock. Much of the bedrock was covered by Atlantic Coastal Plain deposits. Metamorphic rocks resistant to erosion comprised the hills, including the Fordham and Yonkers Gneiss, the Lowerre Quartzite, and the Manhattan Schist. The Hudson, Harlem, and East Rivers and the major north-south valleys in (what is now often referred to colonially as) northern Westchester County are all underlain by easily-erodible Inwood Marble formed from the metamorphosing of shallow water marine carbonate and clastic sediment. The formation of Inwood marble extended to the Inwood section of northern Manhattan. The rocks of the Manhattan Prong were tightly folded and metamorphosed primarily during the Taconian Orogeny, about 450 million years ago.
![]() MORE
MORE
In Geologic Time
Much of New York State’s bedrock and the Adirondack Mountains were formed by ancient Precambrian crystalline basement rock forms. About 450 million years ago the biotite-rich bedrock (made of gray quartz and white orthoclase) known as the Manhattan Schist transformed from shale to metamorphic rock, and constituted part of Manhattan (from the Munsi language of the Lenni Lenape/Delaware “island of many hills”) during continental collision between the floor of the present-day Atlantic Ocean, and what would later be known as the East Coast of North America. In the area often referred to as midtown Manhattan, the bedrock lies within a few feet of the ground’s surface, and within 40 feet of the surface in lower Manhattan making skyscrapers possible, whereas accessing the bedrock was (and still is) cost-prohibitive at a depth of 4-5 times deeper in other parts of so-called New York City.
![]() MORE
MORE
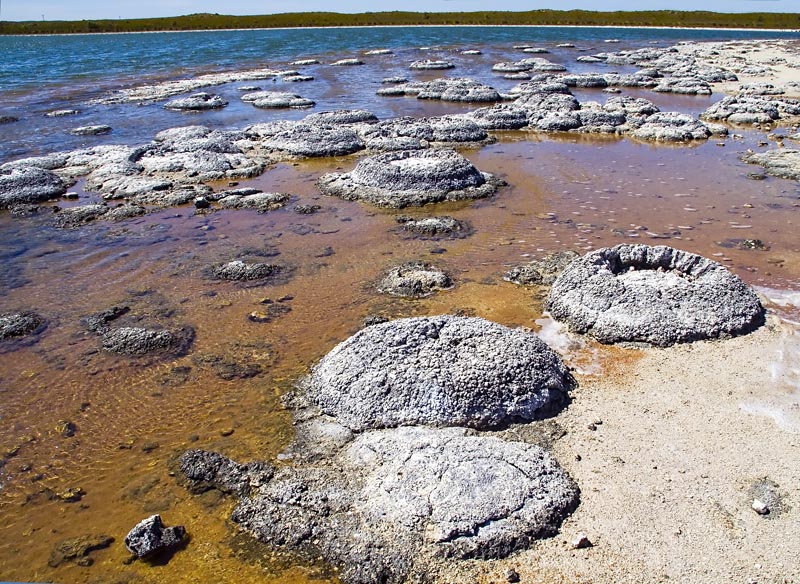
Shallow Seas
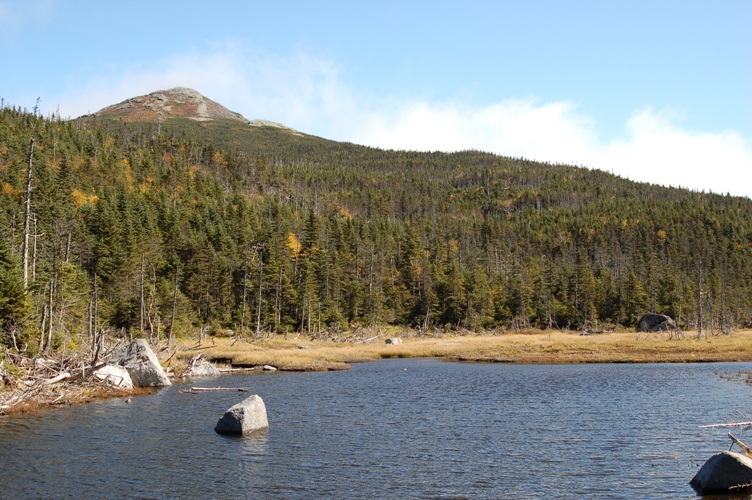
During the Paleozoic Era, parts of the region were uplifted to form the Allegheny Plateau (a physiographic section of the larger Appalachian Plateau province). Other areas nearby were flooded by shallow seas depositing sedimentary rock sequences. Stream erosion crossed the plain and carved away all of the rock except the harder stone of the higher peaks of the Catskill Mountains, which all have about the same elevation today. Much of the rocks in the Catskill Mountains were deposited by rivers near sea level, and are composed of Devonian-aged sedimentary bedrock (sandstones, shales and conglomerate formed in ancient river valleys). The green and red striated clays visible on the edges of stream banks are ancient glacial lake deposits eroded from siltstones and shales that contain fossil remains of plants, clams, and insects from the Devonian Period.
![]() MORE
MORE
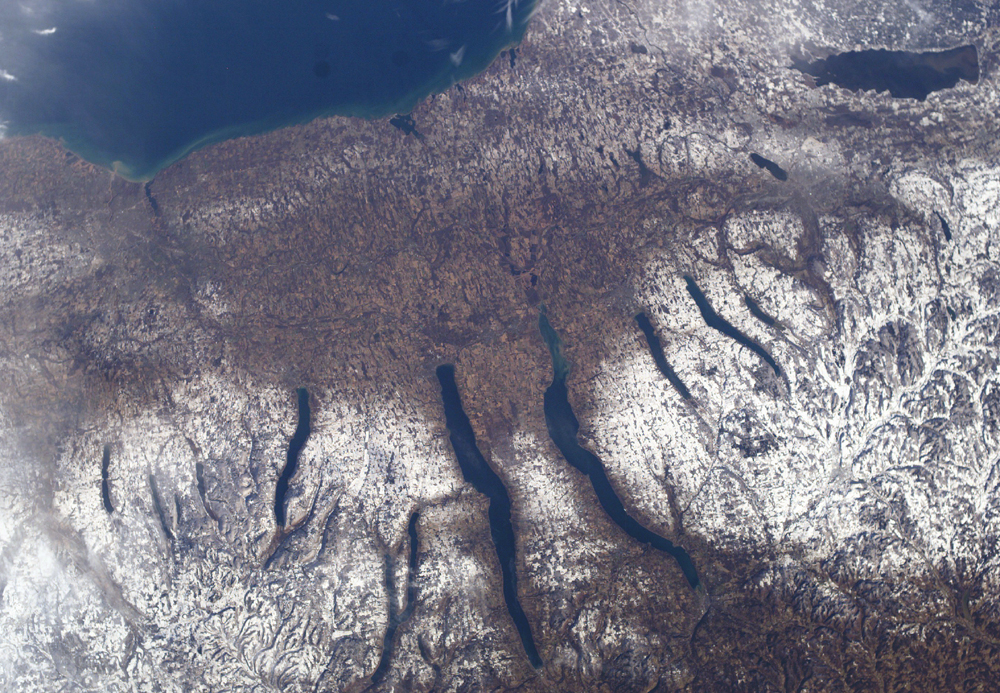
The Pleistocene
Fast forward to 2.6 million years ago and in the Pleistocene Epoch glaciers carried along vast amounts of sands, soils, gravel, and boulders leaving deposits up to 300 meters thick in some valleys. This left the Catskill region low and flat, and hollowed existing trenches as mammoth ice sheets repeatedly advanced across New York State. The towering ice widened and expanded former river valleys to make the Finger Lake troughs. Some of the finger lakes were pushed down so deeply by these glaciers that their earlier bedrock floors lie below sea level.
![]() MORE
MORE
Waterscapes
While it took 3.8 billion years to sequester minerals that surround what is still commonly referred to as New York City and build a baptismal freshwater flow, it took less than 100 years of industrial experimentation to corrupt it, and more than 150 years to build a public water system that’s been continually in process…
![]() MORE
MORE
Colonization and the Power of Language
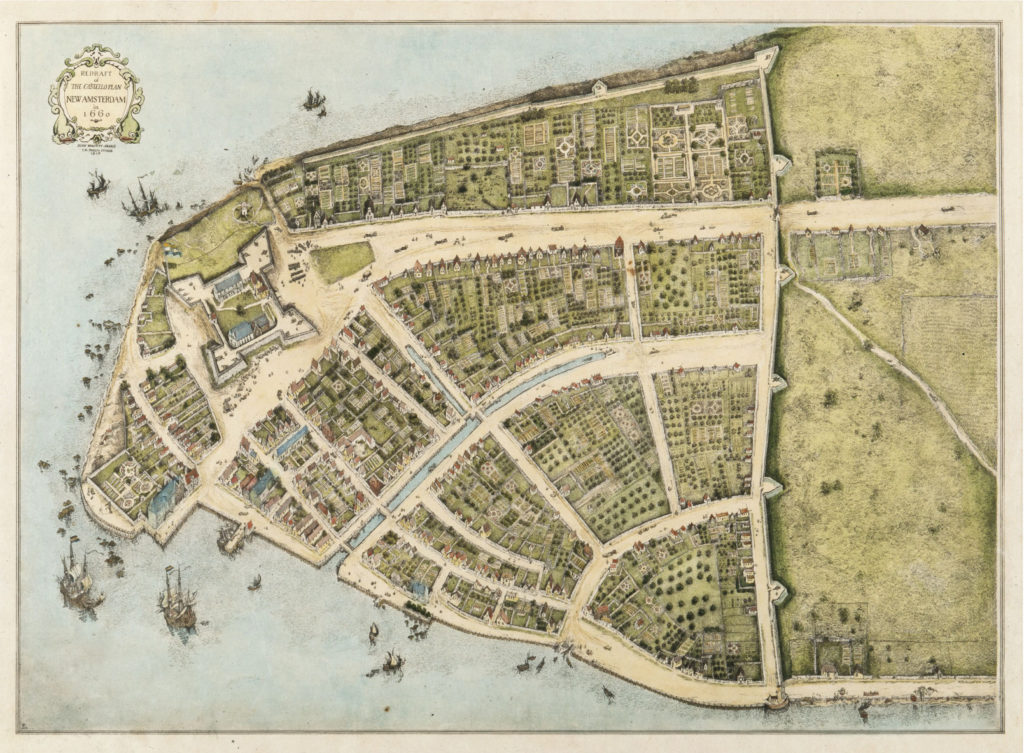
At the time of European contact in the 16th and 17th centuries, the Wappingers and Canarsee inhabited Manhattan Island in semi-permanent settlements. They were Eastern Algonquian-speaking subgroups of the Algonquian peoples. The Lenni Lenape once occupied most of the northeast coast and Westchester, Putnam, and Dutchess Counties as well as the land between the Delaware and Hudson Rivers—this is known as Lenapehoking, meaning Land of the Lenape. As the myth goes, the Dutch “purchased” Manahatta island from the Canarsee Lenape in 1626. The Canarsee likely viewed the “sale” of Manhattan as a deal to share the land, but not to sell it. The transaction, enforced by the eventual building of a wall around what the Dutch had renamed as New Amsterdam, marked the very beginning of a forced mass migration of the Lenni Lenape from their homeland. The wall, which started showing up on maps in the 1660s, was built to keep the Native Americans and the British out. It eventually was renamed Wall Street, and Manahatta was renamed Manhattan (Smithsonian). Lenni Lenape placenames including Gowanus, Hackensack, Manhattan, Passaic, Rockaway, and Weehawken make up the toponymy of metropolitan New York.
The Lenni Lenape of the Esopus (including Catskill, Mamekoting, Waranawonkong, and Wawarsink) lived within the watershed and began encountering Dutch settlers in the early 1600’s. Later, waves of immigrants settled in the area. The new arrivals slowly pushed Native Americans from these ancestral lands. Historians have traced the beginning of water privatization to around the same time as in Malvern, England. There, spring water was first bottled on a commercial scale at The Holy Well. During the second Anglo-Dutch War, New Amsterdam was renamed New York to honor the Duke of York. The Duke of York later became King James II of England and James VII of Scotland. In 1667, the first public well was dug in front of Bowling Green, New York.
![]() MORE
MORE
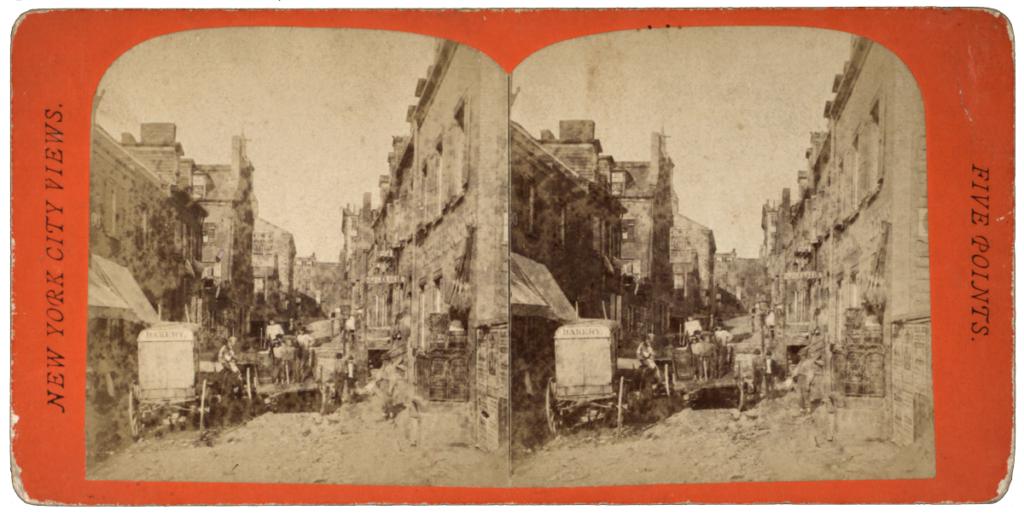
Toxic Water, Part I
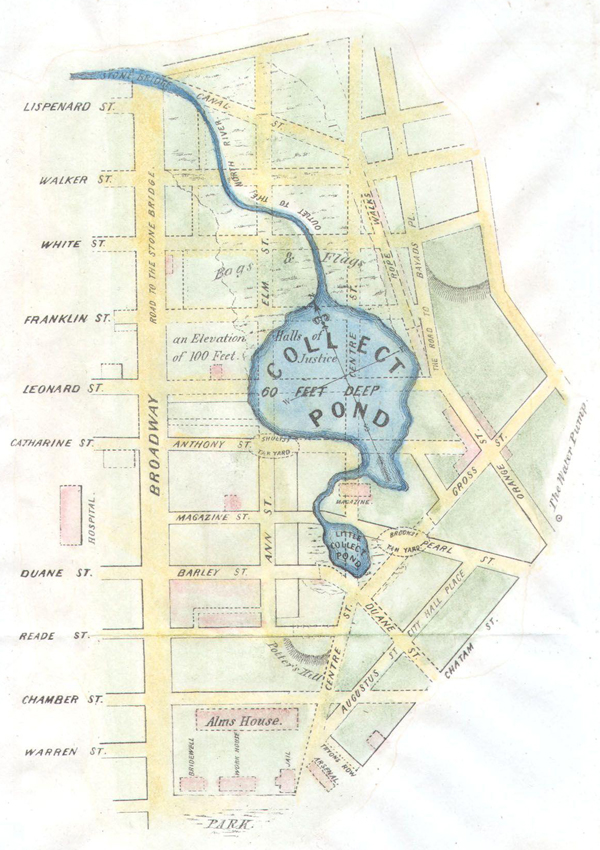
While New York City’s water is now touted as some of the cleanest, unfiltered water, this was hardly the case in the 1600’s. The first well dug in 1667 pumped briny water, so most people drank from the Collect, which was the region’s main freshwater source. However, the Collect eventually became a site to dump chamber pots, dead animals, and tannery waste. It became so polluted the city paved over it, becoming Paradise Square, then Five Points, now Collect Pond Park. In the early 1700’s cleaner water was arduously transported from Brooklyn to Manhattan, which was tapped from wells in Brooklyn and western Long Island. While Brooklyn had an adequate supply of clean groundwater, it could not meet the needs of both Brooklyn and Manhattan residents. As the city’s population increased through the 19th century, more wells were dug without separate systems for sewage and garbage. Additionally, the wells that were dug to tap groundwater were stone-lined and became contaminated with salt water from the Hudson and East Rivers.
![]() MORE
MORE
Toxic Water, Part II
Further fueling the quest for clean water, the foul quality of Manhattan’s water supply caused epidemics of yellow fever (the first of six epidemics killed nearly six percent of the population) and cholera. (The cholera outbreak was caused by the bacterium Vibrio cholerae, often found in contaminated water.) On June 26th, 1832 the first cholera outbreak struck Manhattan. Wealthy New Yorkers fled to the country to avoid infection (about one third of the population), leaving mostly immigrants and low-income families. More than 3,500 people died, with the first of many deaths in the Five Points neighborhood (current day Foley Square and Chinatown), where many Irish-Catholic immigrants and African Americans lived. The need for a new supply of fresh water for residents was crucial.
![]() MORE
MORE
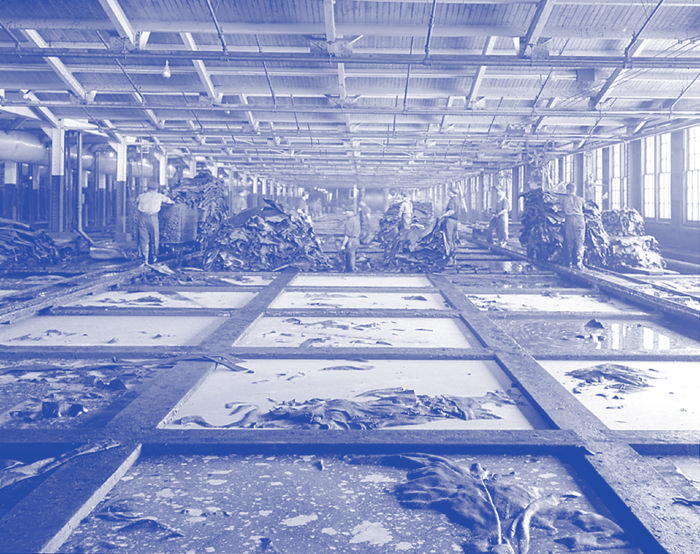
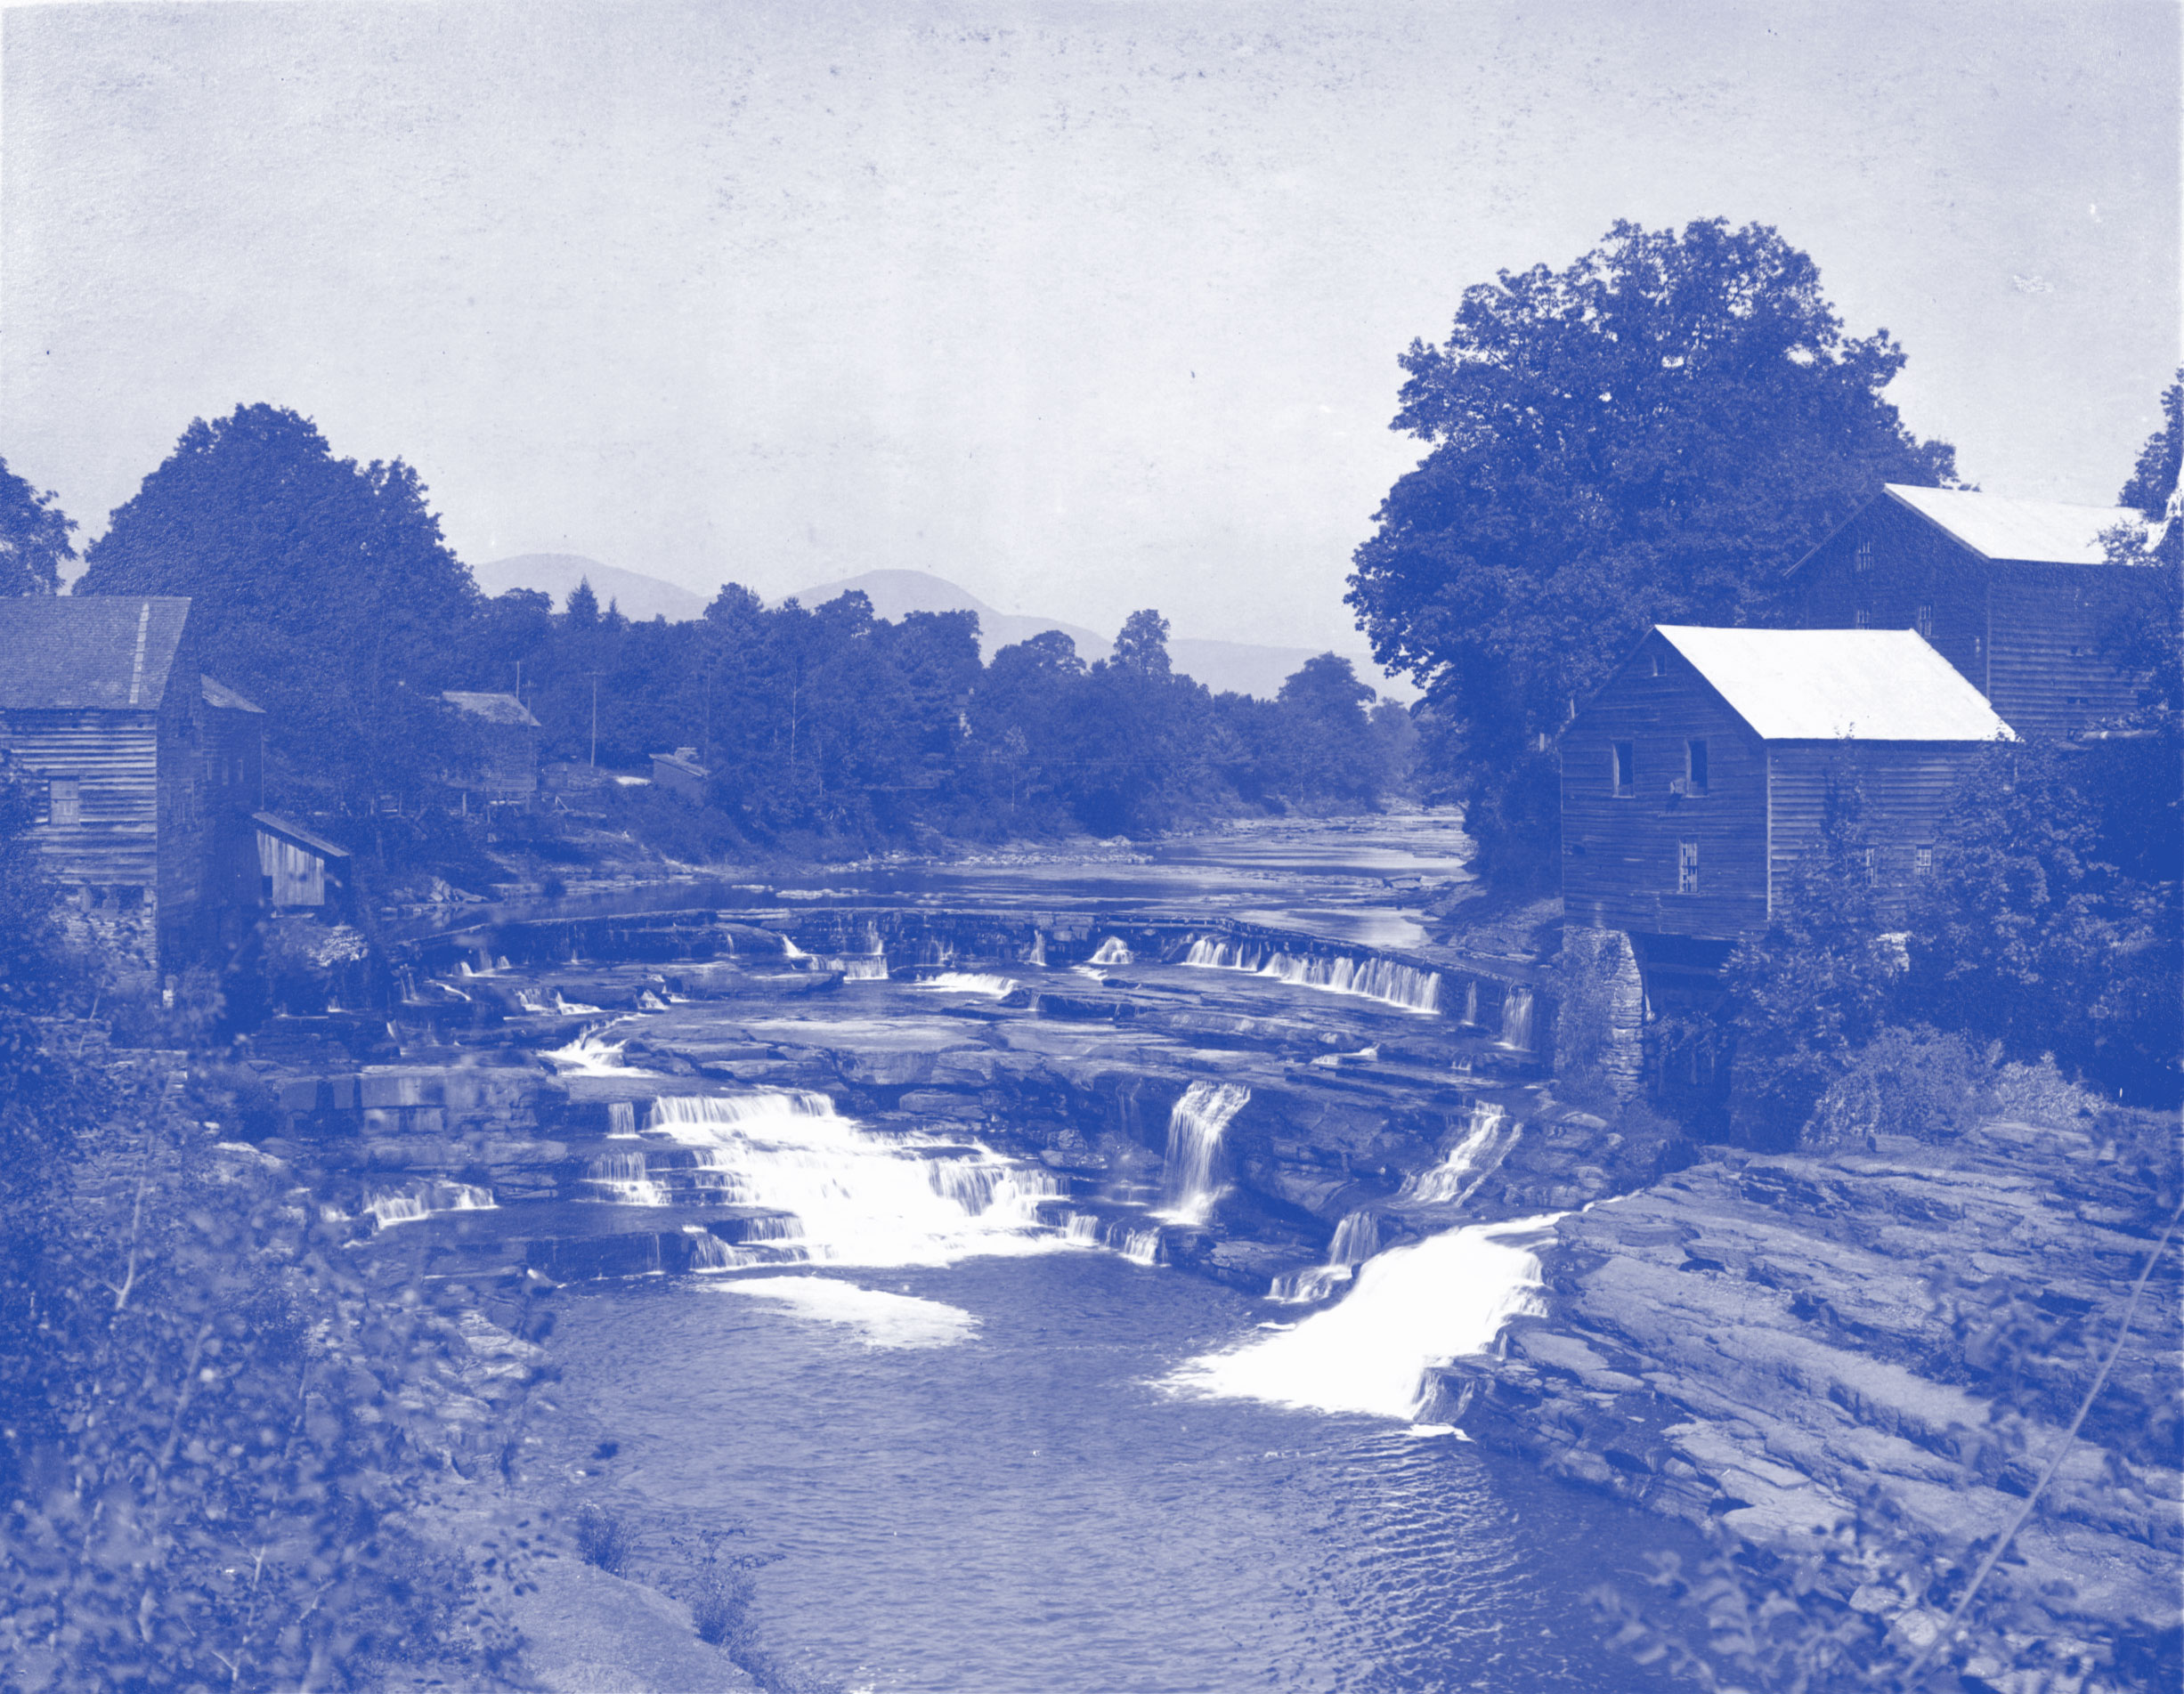
Tanneries
Around the same time, much of New York’s Catskill Mountain region and the Ashokan Watershed area had become central to resource extraction. Tanneries would be supplied by the area’s verdant hemlock trees, while charcoal kilns and quarries sprung up along rivers, creeks, lakes, streams and expanding trade routes.
![]() MORE
MORE
Privatization, Part I: International Water Infrastructure
Internationally, a procession of water giants began to surface: Suez, Veolia, and Thames were among them. The dissolution of land-based commons (and with it, appropriation of many peoples sustenance) was perceived essential for the industrial revolution to provide the amount of “natural resources” to process raw material into industry. Commoditization of land, water, forests, fisheries, seeds, and knowledge had propelled a particular logic of privatization which would later become a crucial aspect of free trade ideology.
![]() MORE
MORE
Privatization, Part II: Hamilton, Burr, and the Manhattan Company
Manhattan’s drinking water went through several privatization schemes as early as the 18th century. These were led by two State Assemblymen, Alexander Hamilton and Aaron Burr. Burr convinced city officials that public funds would be inadequate to develop a suitable reservoir and aqueduct. He created the Manhattan Company (later to become Chase Bank) to serve the public as the sole supplier of water and took control of the city’s water system in 1799. However, hidden in the bill that granted a charter to the Manhattan Company was a clause that stated that the company could use any surplus capital for other purposes. The company was expected to tap into the Bronx River but instead drilled wells into the polluted Collect Pond, which was much cheaper. Additionally, the company only laid 23 miles of pipes and charged an expensive rate of 20 dollars a year, which made it inaccessible to many citizens. Two thirds of the population still relied on polluted wells or buying spring water from expensive private vendors. Because of these failures, in 1816 several Common Council committees were appointed to investigate whether the legislature could grant the city the right to build a public water supply; however, nothing immediate was done about the toxic water and poor service. The first changes began around 1828 after repeated fires destroyed blocks because water mains and fire hydrants had not been extended to all parts of the city.
![]() MORE
MORE
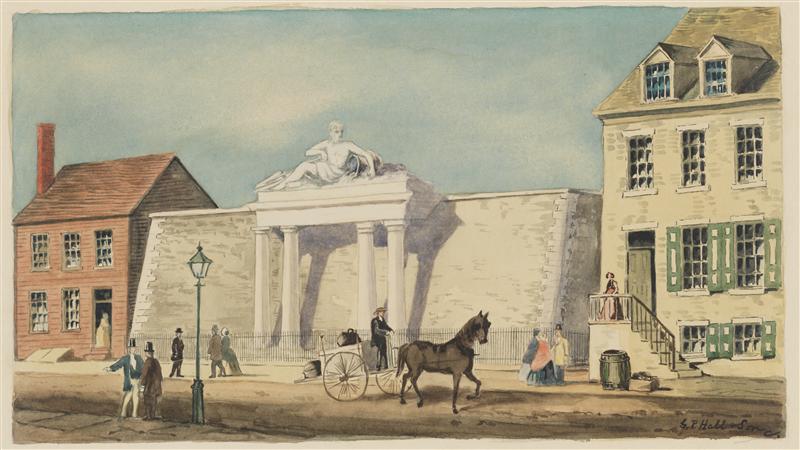
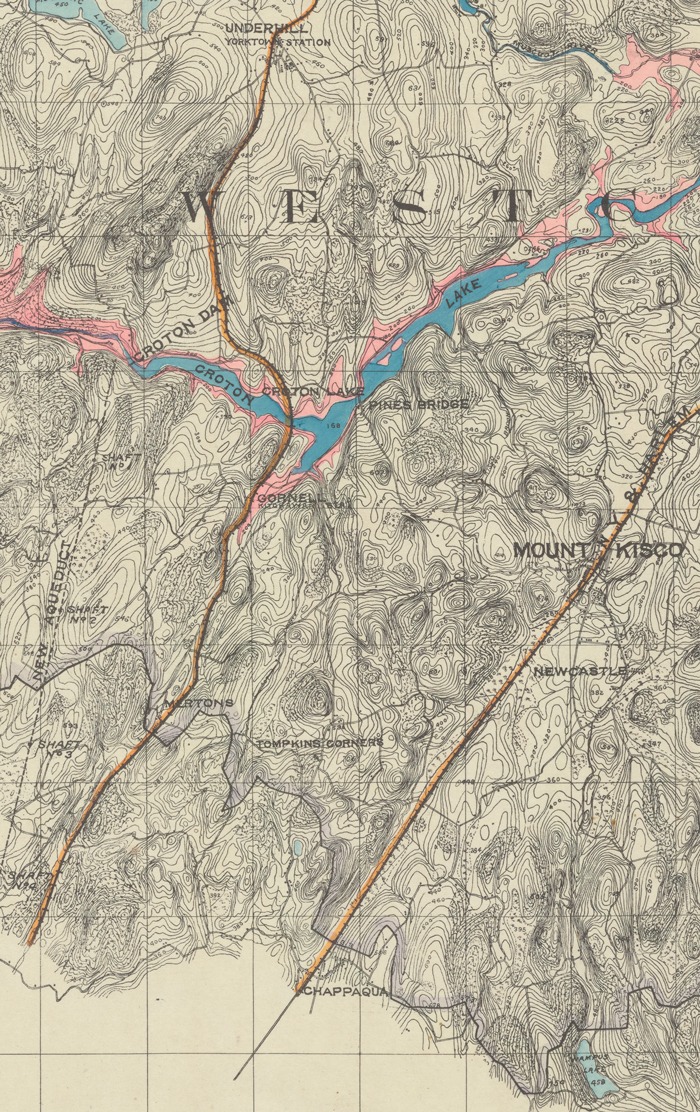
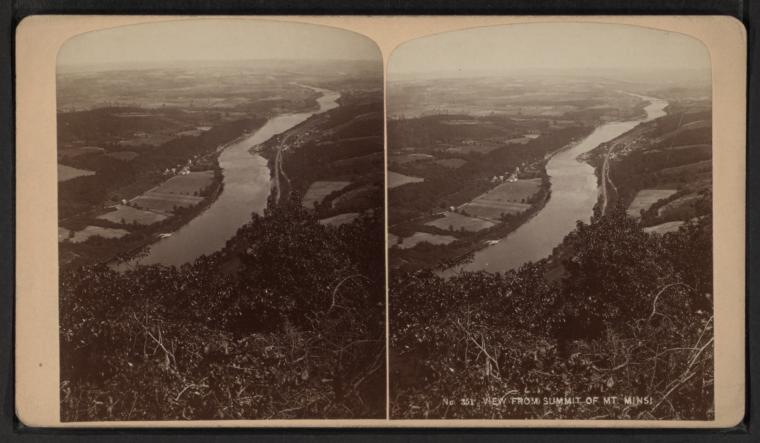
The Old Croton Dam
After exploring alternatives, in the late 1820’s, city officials made plans to extract water from the Croton River in Westchester County. The development of the city’s first successful public water supply system was a major engineering undertaking, constructed by almost 4,000 immigrants. The Old Croton Dam created a lake about 400 acres in size. The dam received considerable pushback from Westchester residents, who argued that it “disfigured their fields and divided property.” Water started flowing through the aqueduct on June 22, 1842, bringing water 41 miles from the Croton River to reservoirs in Manhattan. This changed domestic life in the city. Baths and running water were built in the private homes of wealthy New Yorkers, and public bathing facilities were constructed for everyone else. However, the decline in the number of residents drawing water from the city’s wells rose the water table and created floods. In an effort to further sanitation, city agencies also built sewers in many residential streets.
![]() MORE
MORE
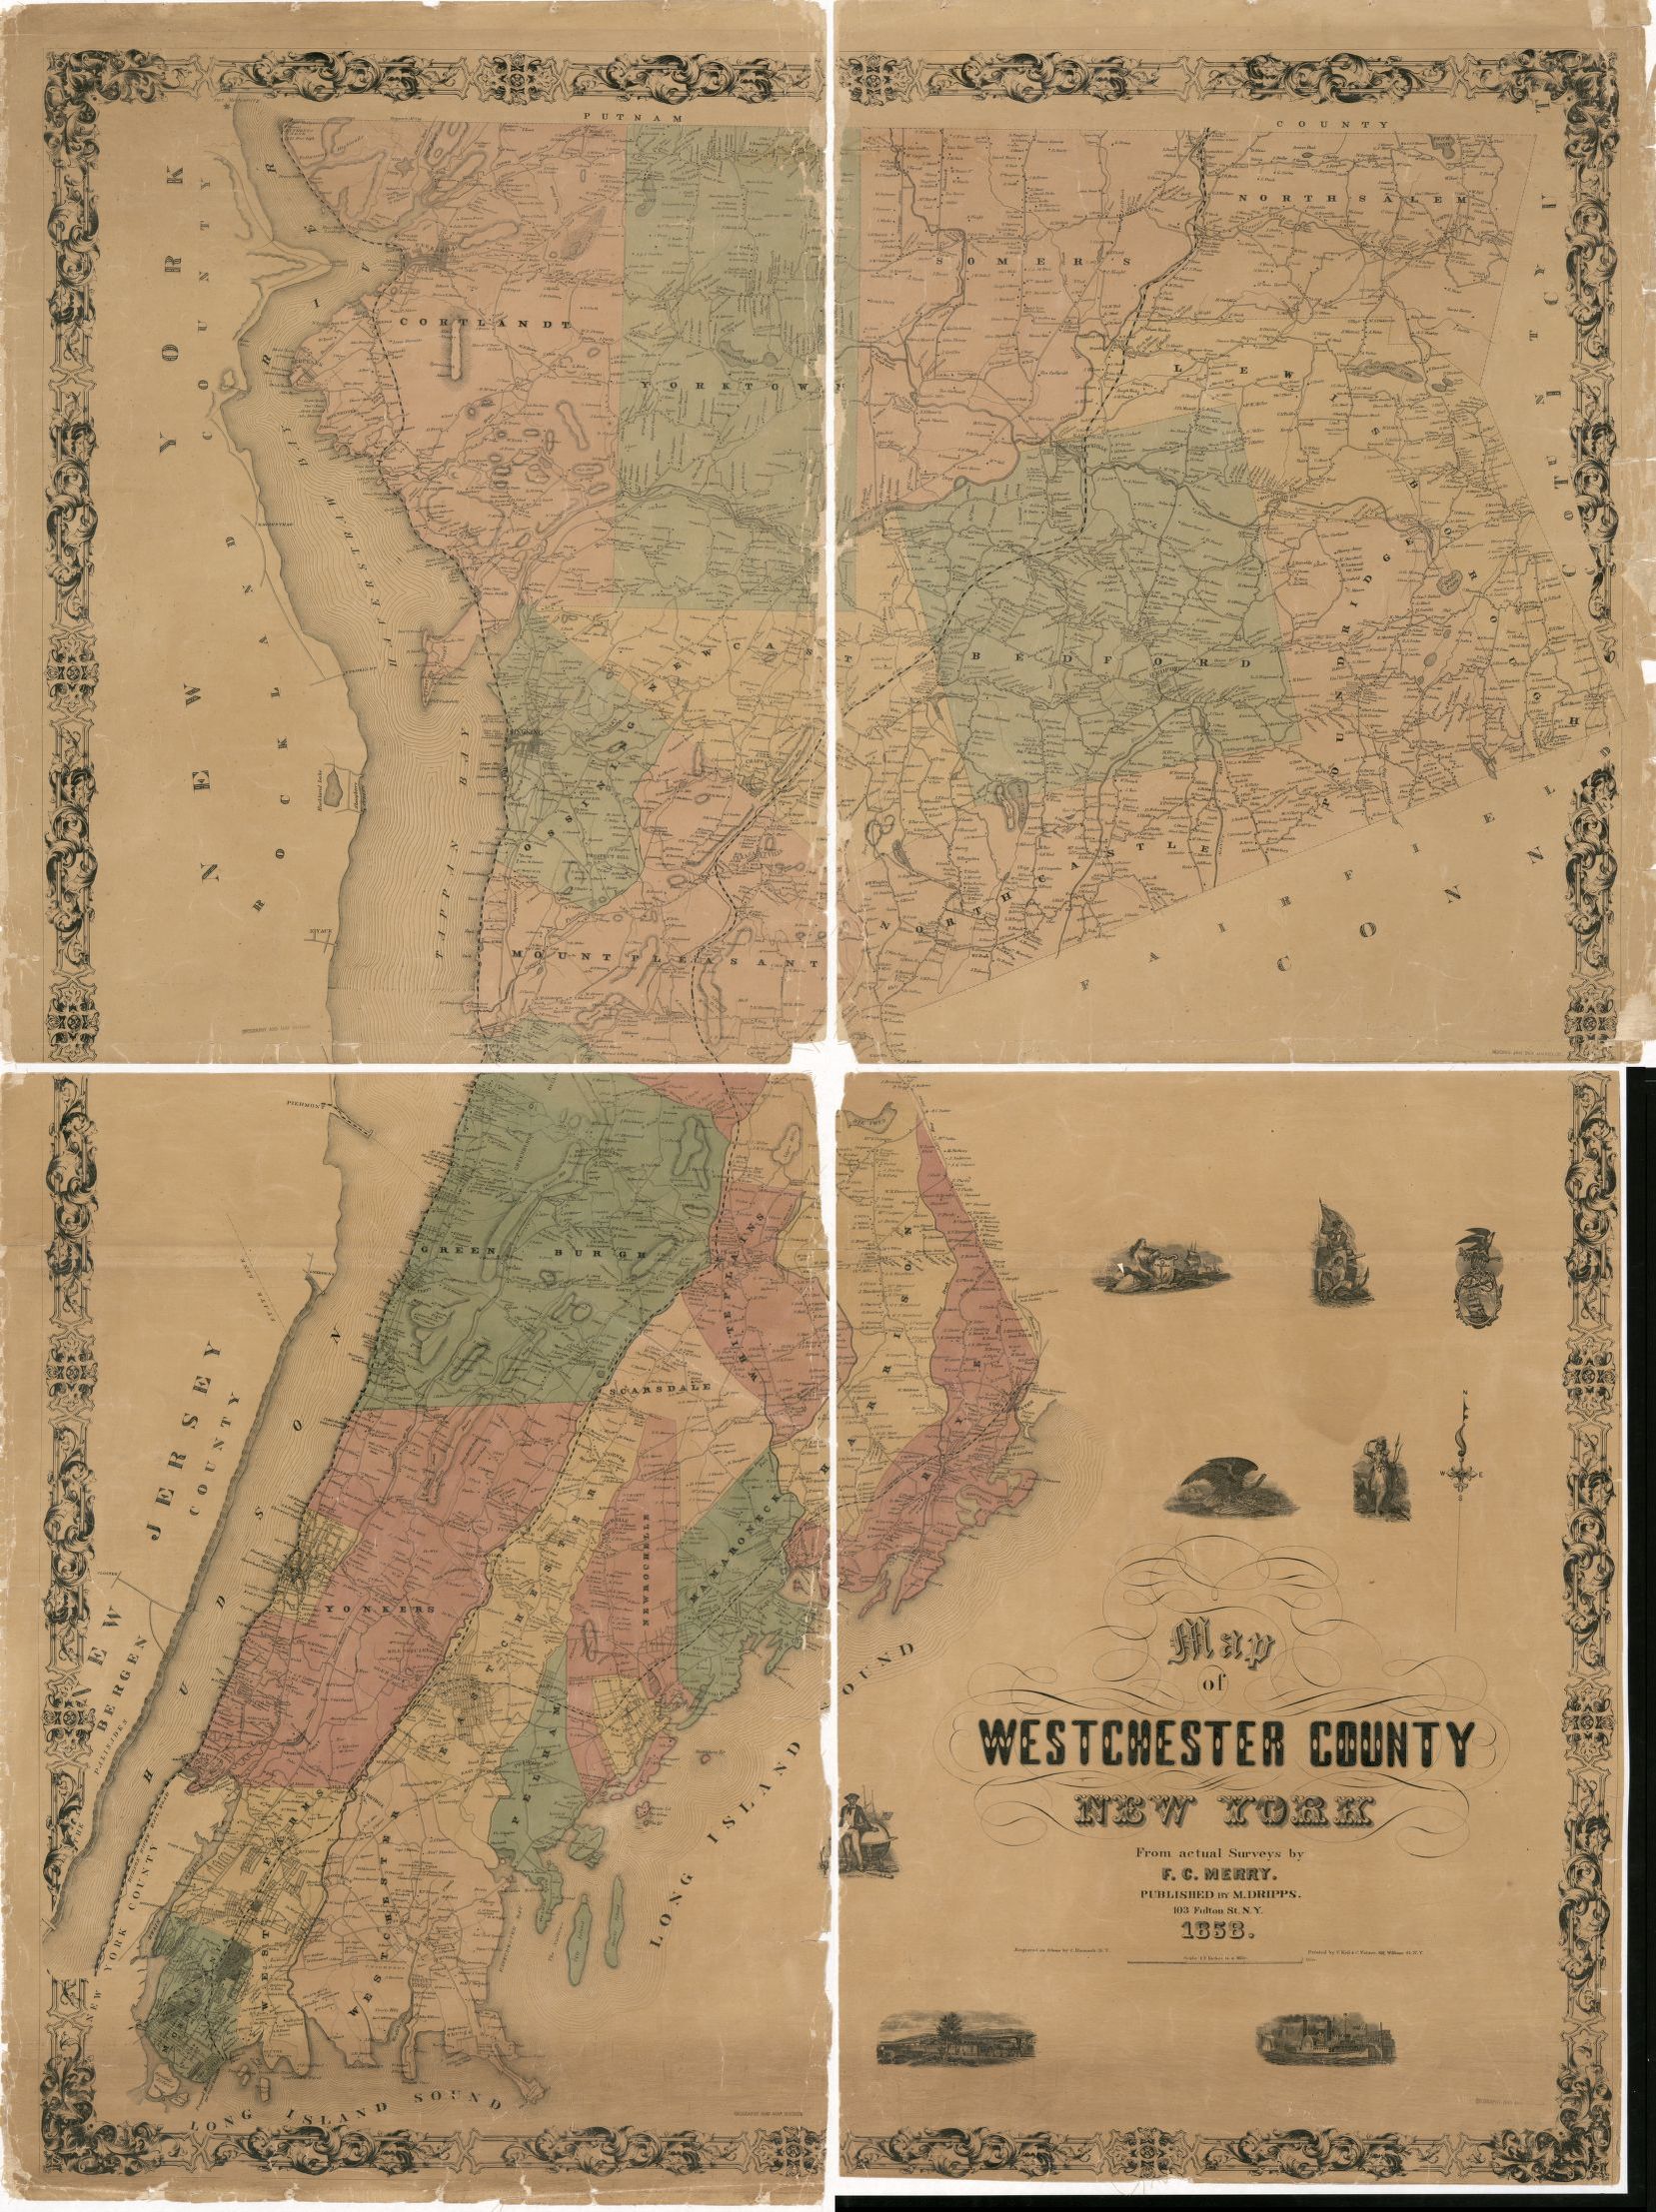
Source: Library of Congress. Link.
From Westchester to a Manhattan Potter’s Field
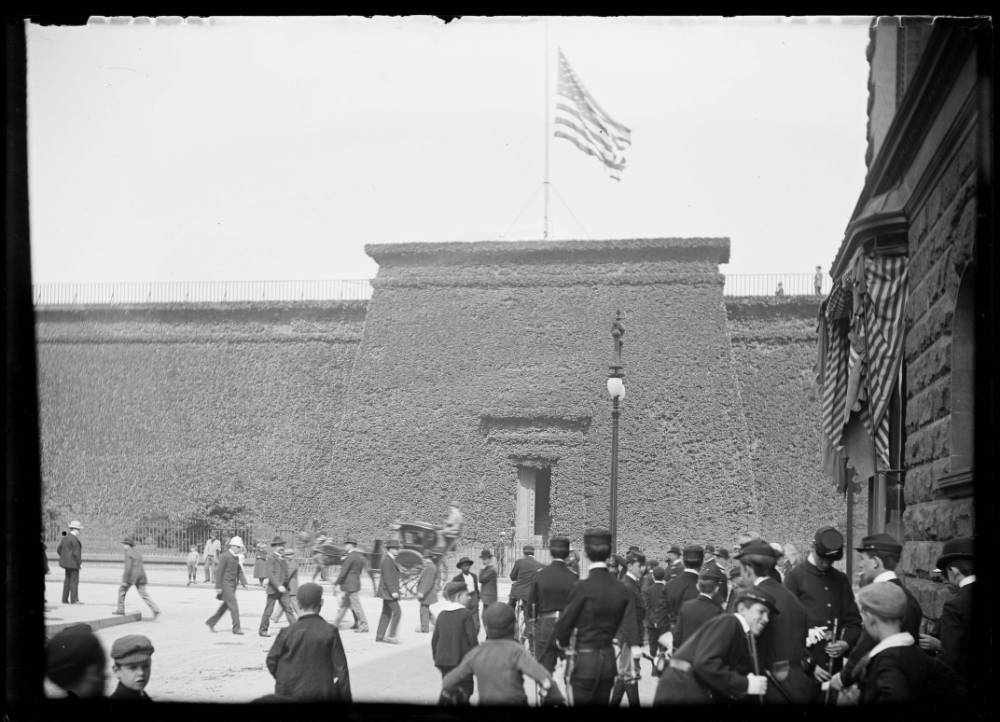
Many New York City residents viewed the watershed as an abstraction, and yet lived with some of its prominent infrastructure that transformed the face of the city. This included the High Bridge (which carried the old Croton Aqueduct over the Harlem River into Manhattan), Central Park’s two reservoirs, and the Croton Reservoir at Manhattan’s Murray Hill. The Croton Reservoir, with its 50’ high granite walls and public promenade atop, stood where the main branch of the New York Public Library and Bryant Park are today. Before it was a reservoir, the land where Bryant Park now stands was a potter’s field. To build the reservoir, thousands of bodies needed to be exhumed and reburied on Wards Island. The reservoir contributed to 5th Avenue becoming one of Manhattan’s most fashionable streets.
![]() MORE
MORE
Becoming Boroughs
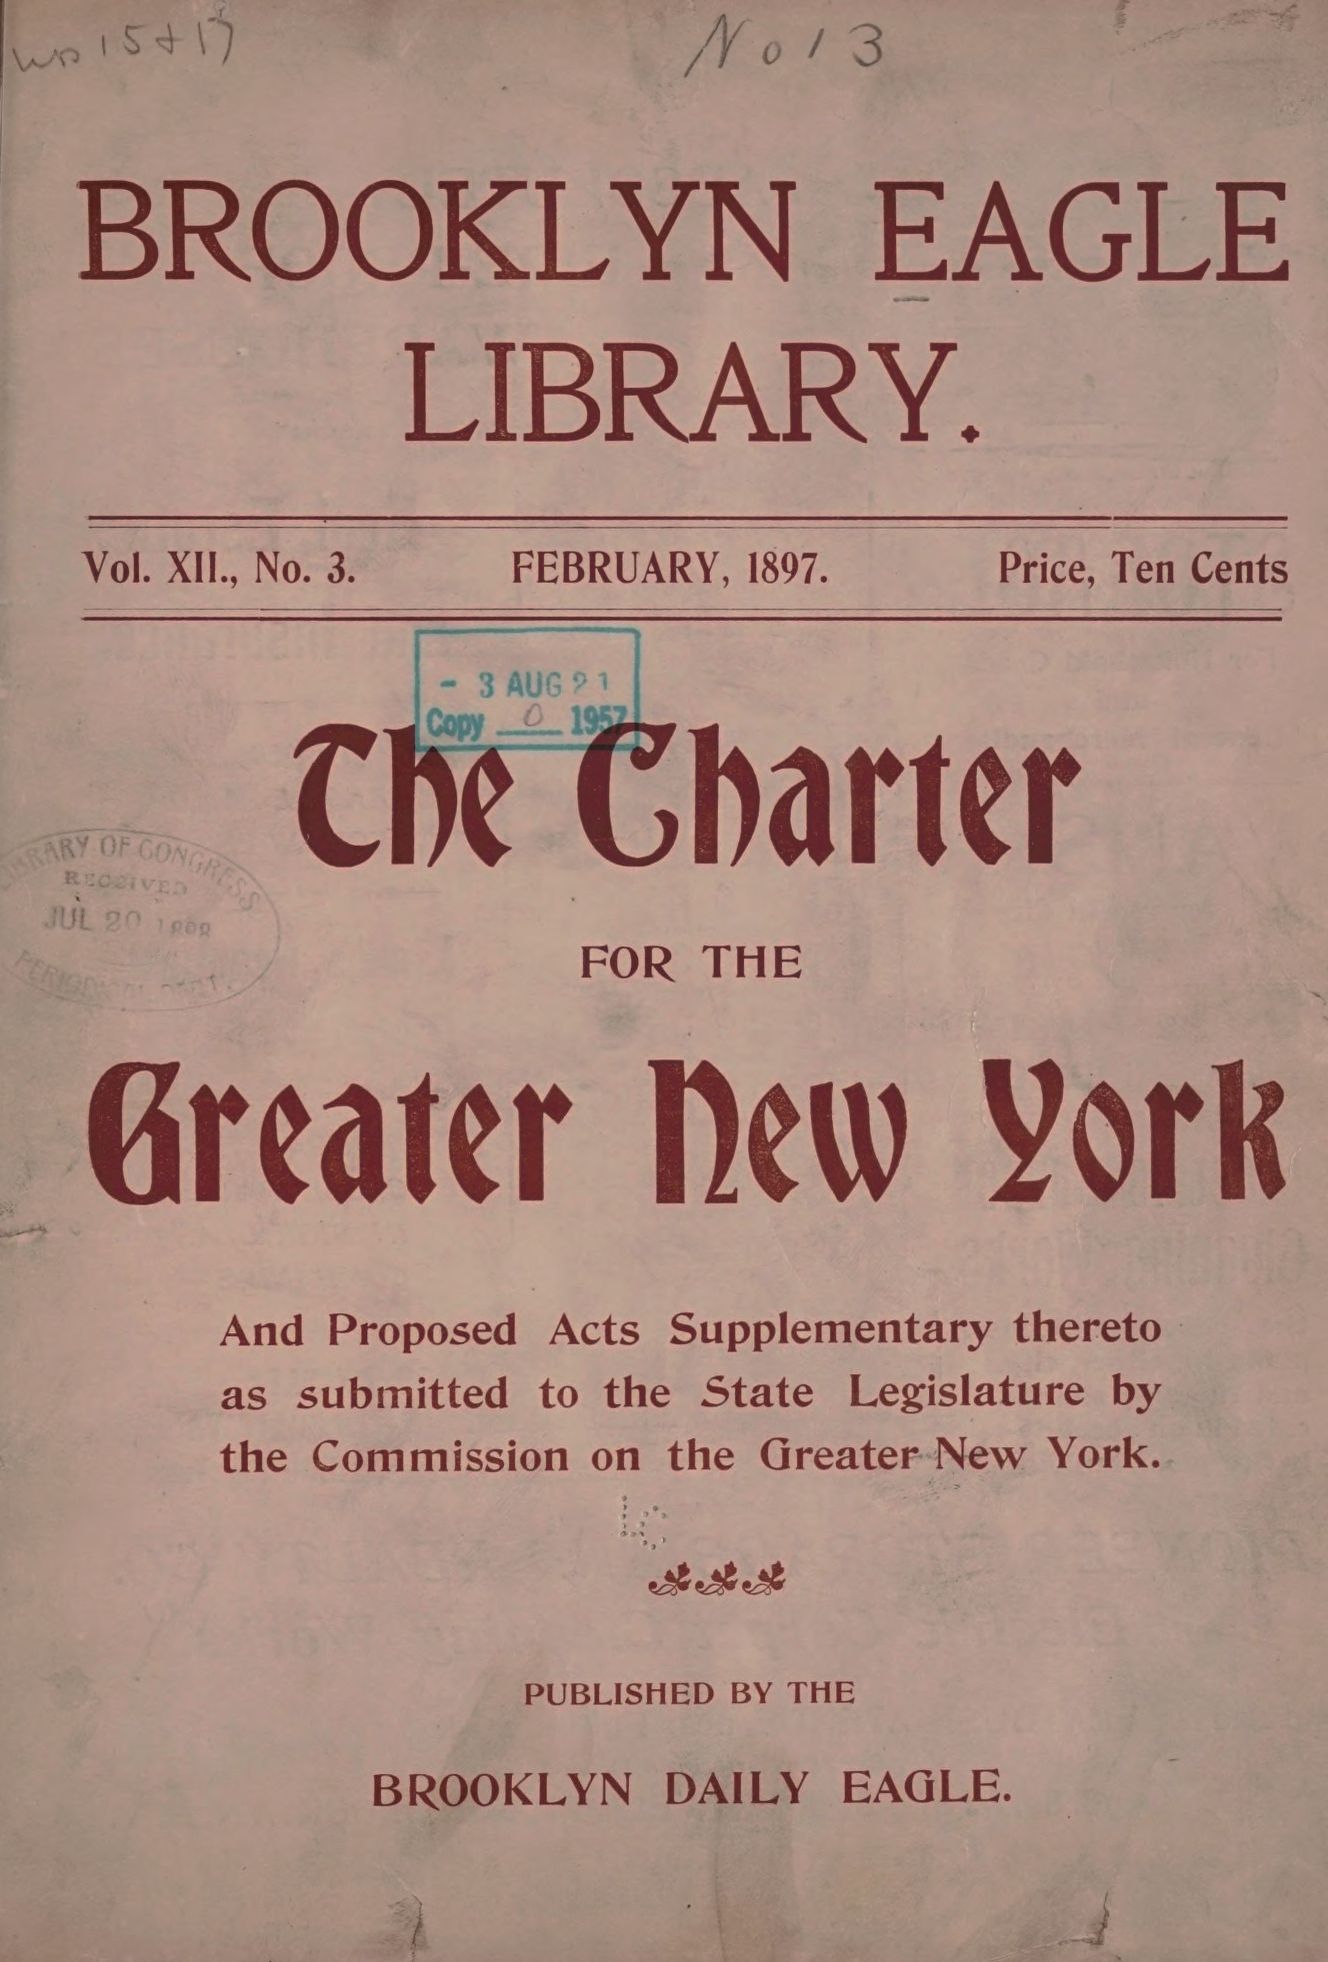
Brooklyn’s water supply was falling short of demand. The inducement of an improved water supply provoked Brooklyn and Staten Island’s residents to vote for annexation by Manhattan, and to become boroughs of New York City. However, this incorporation would require New York City to undertake another expansion. The commonality between all of the options for expanding New York City’s drinking water supply was the local communities disdained and resented the idea of ceding current or future water sources to the city.
![]() MORE
MORE
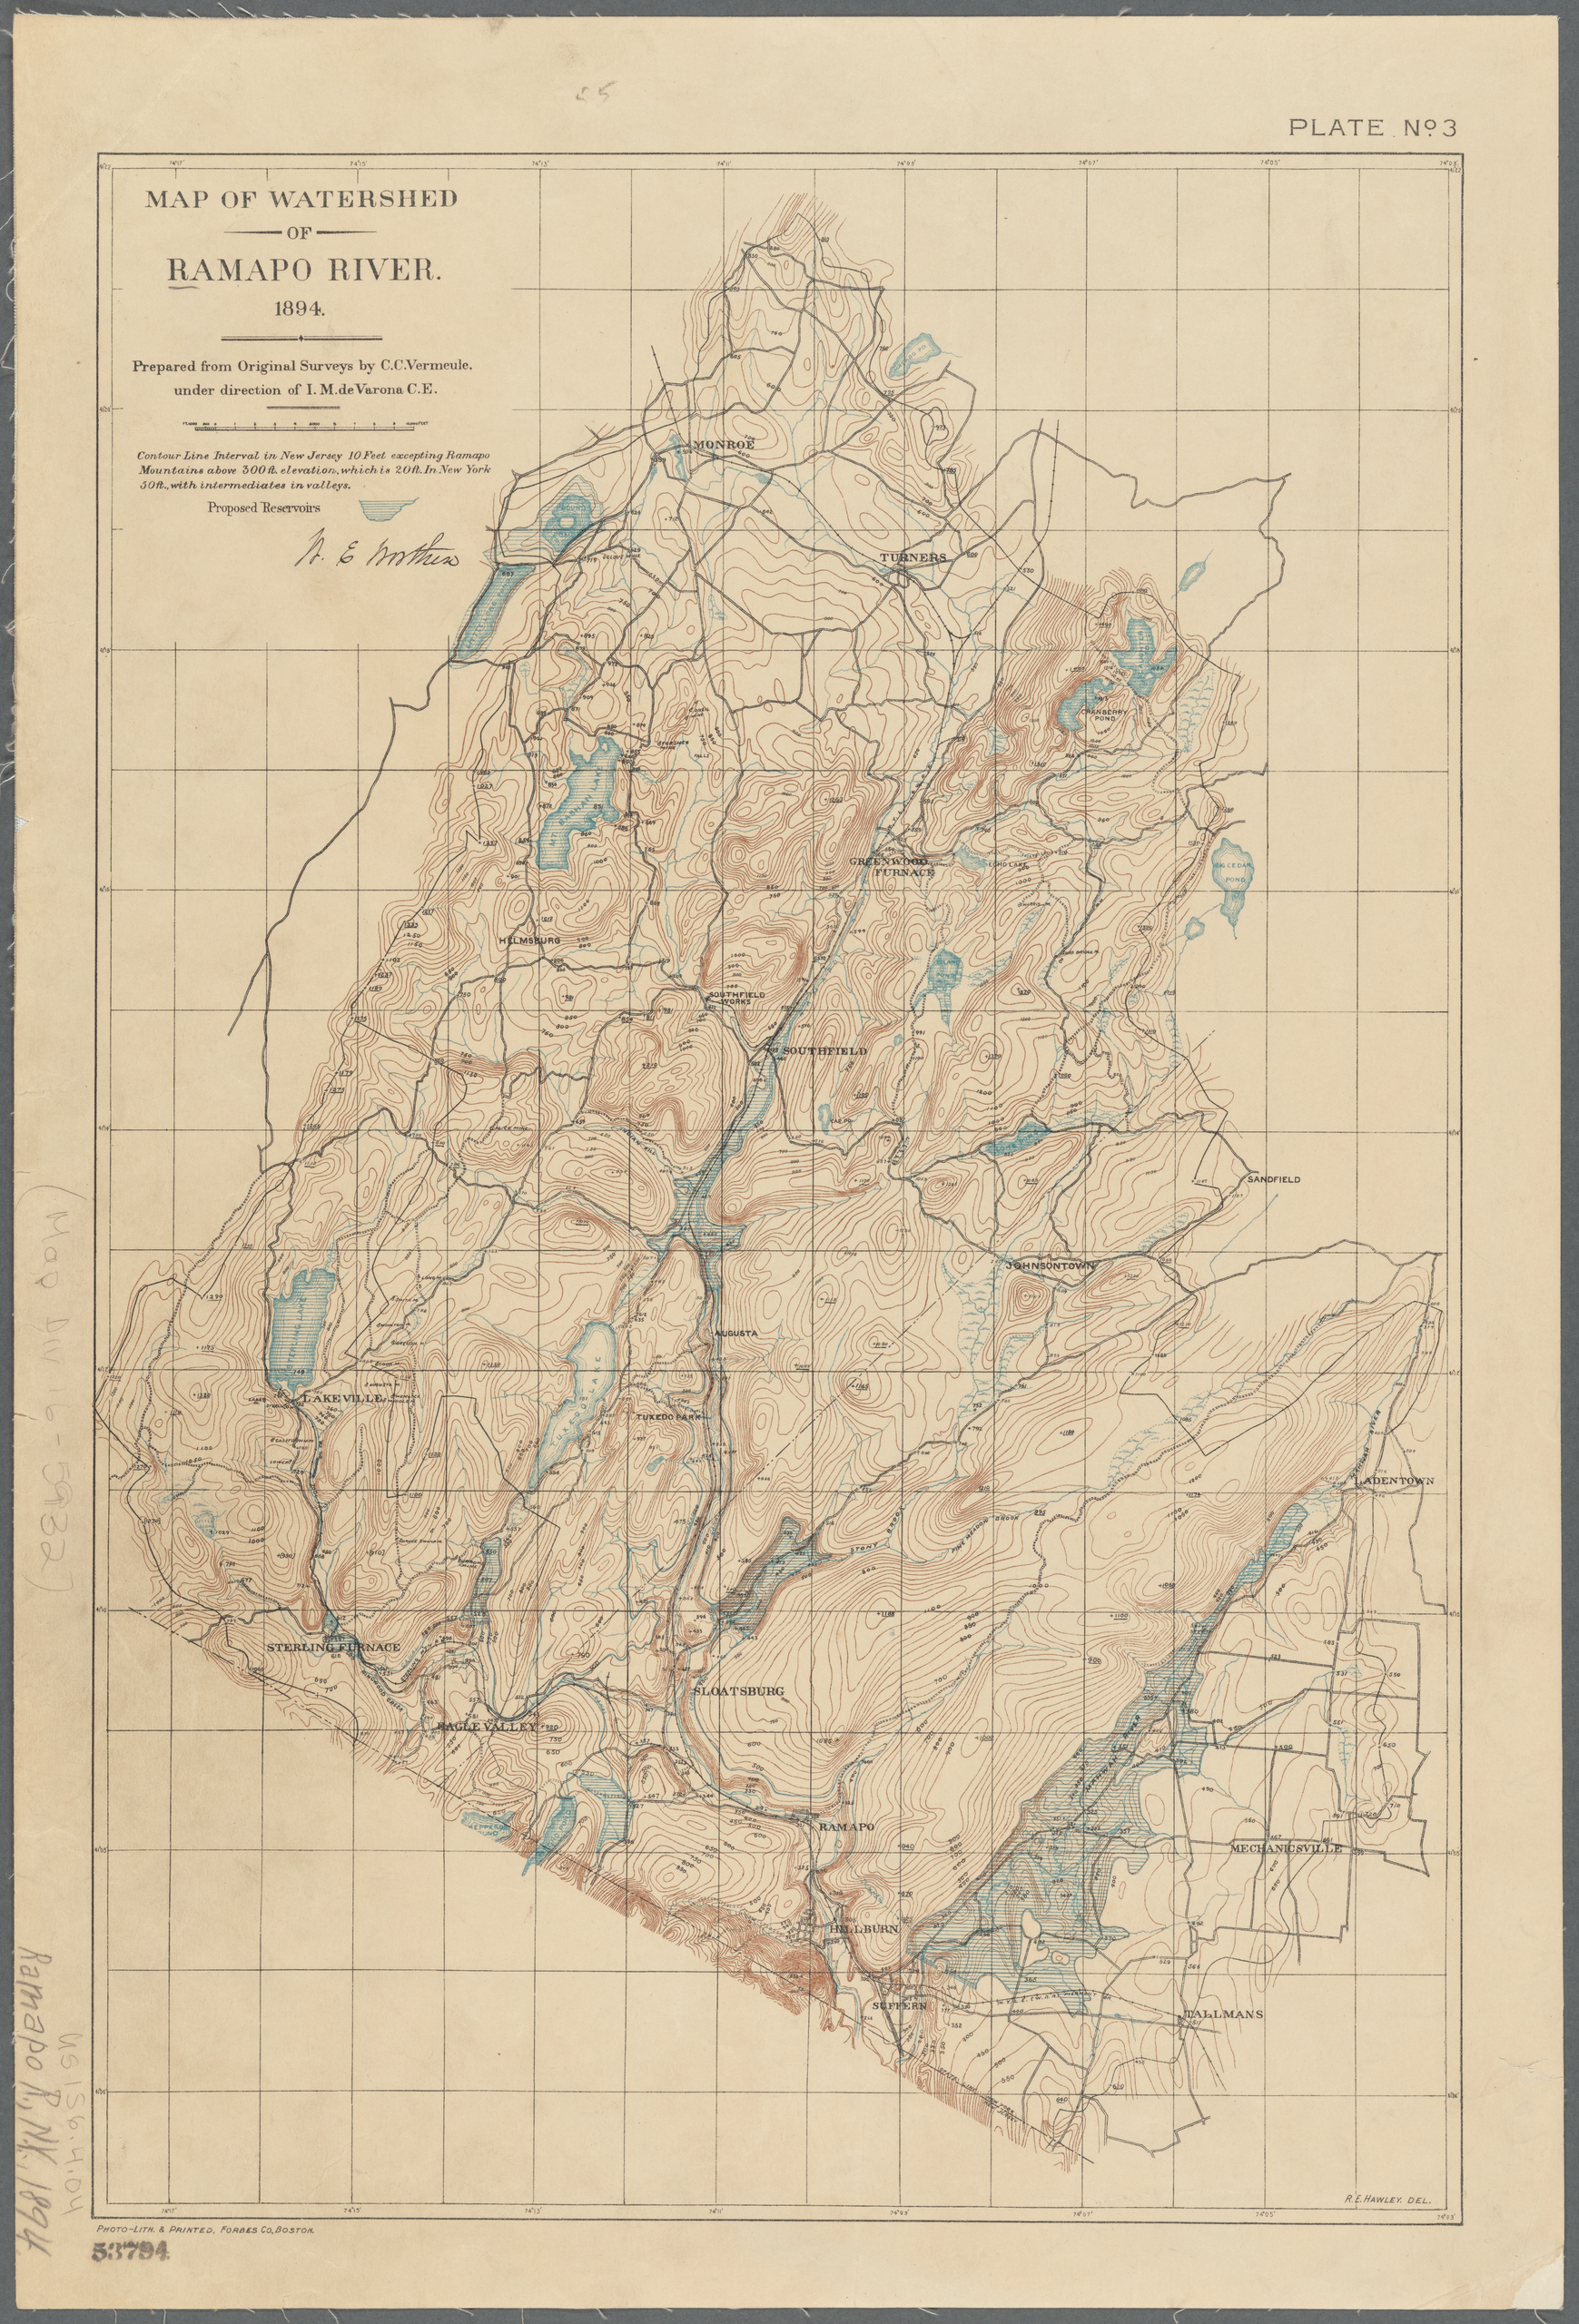
Ramapo
As New York City looked to expand its water supply beyond the Croton Dam, both public and private sectors stymied the city’s ability to gain access to drinking water. The most egregious was likely the private Ramapo Water Company (likely named after the town in Rockland County, which was named after the Ramapough Lenape Nation meaning “sweet water” or “slanting rocks”), who attempted to gain control of the Catskill watershed in anticipation of the city’s needs. In 1895, the State’s Legislature granted Ramapo land and water rights in the Catskills. Under Ramapo’s control, the city would lose control over the design and cost of the city’s water supply. Furthermore, it was publicly disclosed that privatization would result in an annual municipal deficit and almost triple water costs to the city. Under pressure from the City Merchants Association and the City Comptroller, the State Legislature repealed its decision in 1901.
![]() MORE
MORE
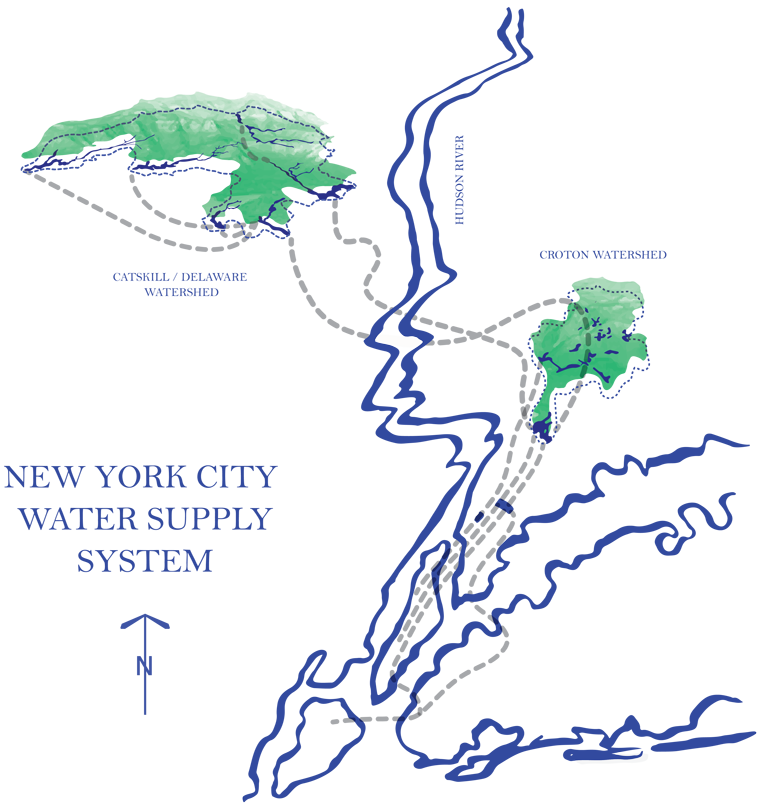
From the Housatonic to the Hudson – Two Plans Subsequently Scrapped
Populations, politics and hydrology shaped New York City’s drinking water. As the city was searching for more water sources in the early 1900s, the ten mile Housatonic watershed (much of which was in Connecticut) was identified as the most promising water source for the city. By 1903 however, legal precedent had established the practical impossibility of tapping interstate waters. That year, an engineering report was completed with a recommendation for the city to develop two new watersheds, one east of the Hudson River in Dutchess County (because of its quick three year build-out timeline), and the longer term Catskill Mountains watershed. Its lacustrine marshes, stagnant pools and rushing spates would later be broken up into the Catskill and Delaware watersheds. The Hudson River was one of New York City’s top options for drinking water because it didn’t cross state lines, even though Albany and Poughkeepsie depended on it for drinking water and it was polluted further downstream. What kept it from being developed, however, may have been its perception: would a city with such tremendous political power not be able to access the cleanest water for its residents?
![]() MORE
MORE
The New Croton Reservoir
By 1906, the aqueduct commission had completed the New Croton Dam which expanded the existing Old Croton Reservoir to include the sprawling New Croton Reservoir, the centerpiece of the Croton network. New York added two more reservoirs over the next several years, finally completing the water system that had begun construction in 1837. The Croton project developed supporters in the budding Westchester County suburbs and nearby communities because they would be able to tap into the water system for their own use. However, it came with many struggles for other Westchester residents. New York City did not pay taxes and often abused farmers and their property, including burning their houses and barns. Going forward, this would be the extent of New York City’s ability to build in Westchester County due to restrictions instigated by Westchester and Dutchess County citizens and put in place by state officials.
![]() MORE
MORE
Water Expansion by Eminent Domain, Part I
While New York City’s use of eminent domain began in 1830, the New York State Public Health law of 1905 allowed New York City to acquire land through eminent domain specifically for the expansion of the water supply area. The use of eminent domain forced thousands to move involuntarily, creating significant animosity towards the city. The uprooting of these families also affected the economy of the region. Much of the area was dedicated to farming, particularly in low lying land by rivers and creeks, which had more productive soil. However, this was exactly the land that the city took in order to build the reservoirs.
![]() MORE
MORE

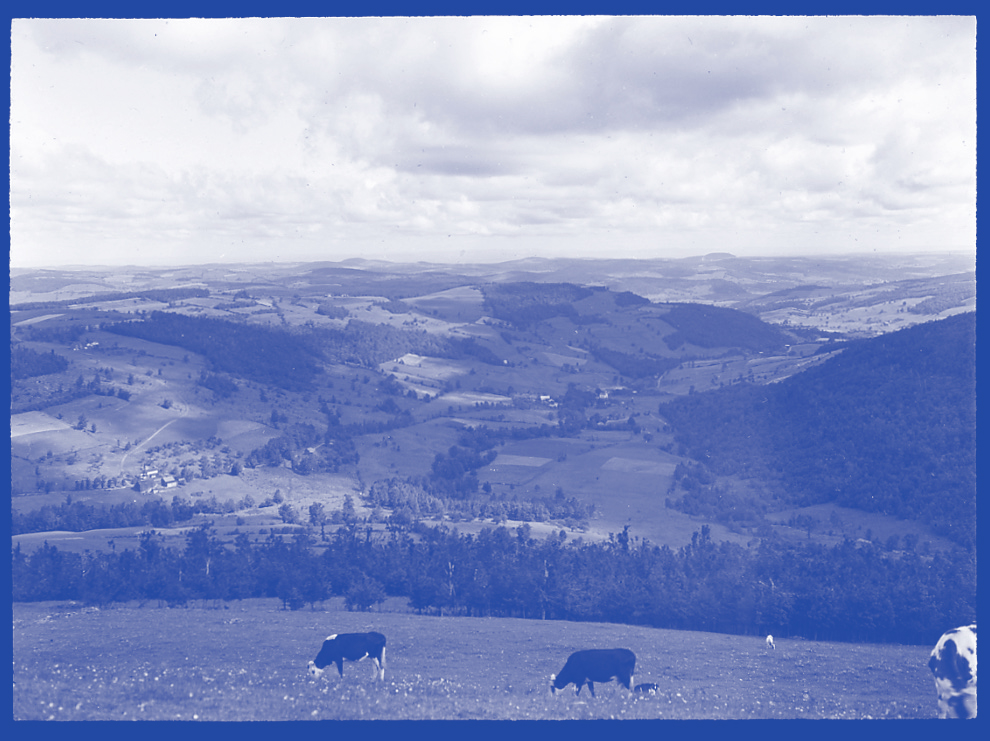
Water Expansion by Eminent Domain, Part II
For future expansion, the Catskill watershed looked the most promising. However, the support of Catskill residents was divided. Some seemed eager to sell their land to the city and others were wary of losing their homes and livelihoods to eminent domain. In stronger opposition, the representatives of Ulster County in Albany preemptively filed legislation to bar New York from tapping the county’s waters. Over the course of a few years however, this political landscape had changed.
![]() MORE
MORE

Flooding the Catskills
With the sanction of higher political authorities, the city appropriated what it saw as the countryside’s resources, and remade ecosystems to sustain its own growth for decades. While Catskills settlers whose land was taken over by eminent domain did see their day in court, many said they only received a modicum of social and economic justice. While thousands of people obtained steady employment as laborers on the Catskill project, waterworks construction harmed the local economy overall by damaging boardinghouse tourism and flooding fertile agricultural land. History repeated itself, in this case often less violently, and glossed over the sacrifices made by displaced watershed residents.
![]() MORE
MORE
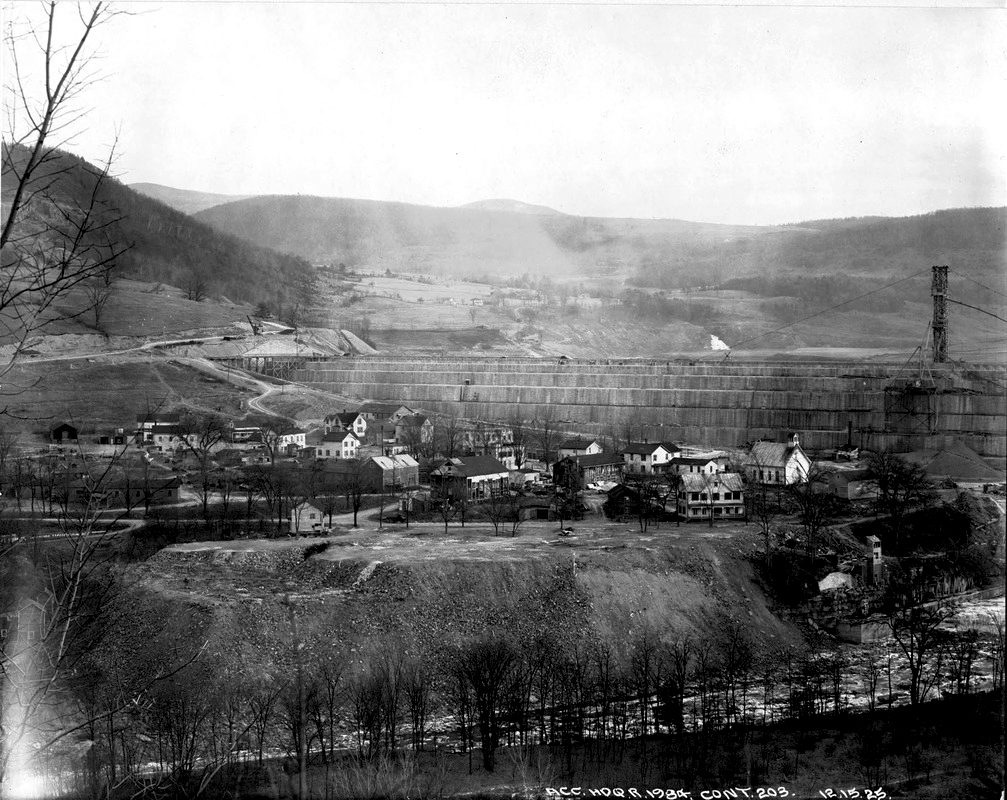
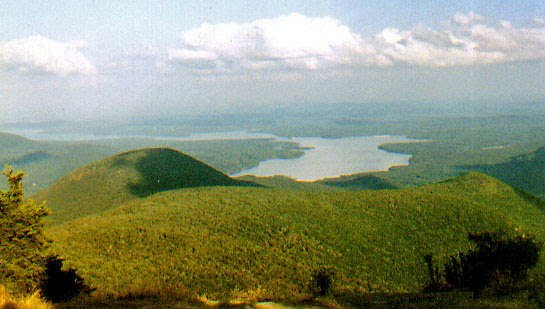
Building The Ashokan Reservoir
In the Catskills watershed, the Ashokan Reservoir would hold 122.9 billion gallons of water at full capacity and would supply approximately 40% of New York City’s daily drinking water needs in non-drought periods. It was constructed under the auspices of the New York City Board of Water Supply (BWS) beginning in 1907. Its weirs, dikes, and the Olive Bridge Dam backed up Esopus waters for twelve miles, necessitating the removal of homes, farms, businesses, churches, schools and other structures throughout the valley. 2,350 residents were displaced as four hamlets were flooded and eight others were relocated. Many of these residents were not paid the full value of their property and were given two months to uproot their lives and move elsewhere. From the reservoir, water entered into the Catskill Aqueduct and headed south through mountains, over 163 miles of terrain, and under the Hudson River to the Kensico Reservoir in Yonkers, NY, which provided a safety net of two weeks water supply for New York City residents.
![]() MORE
MORE

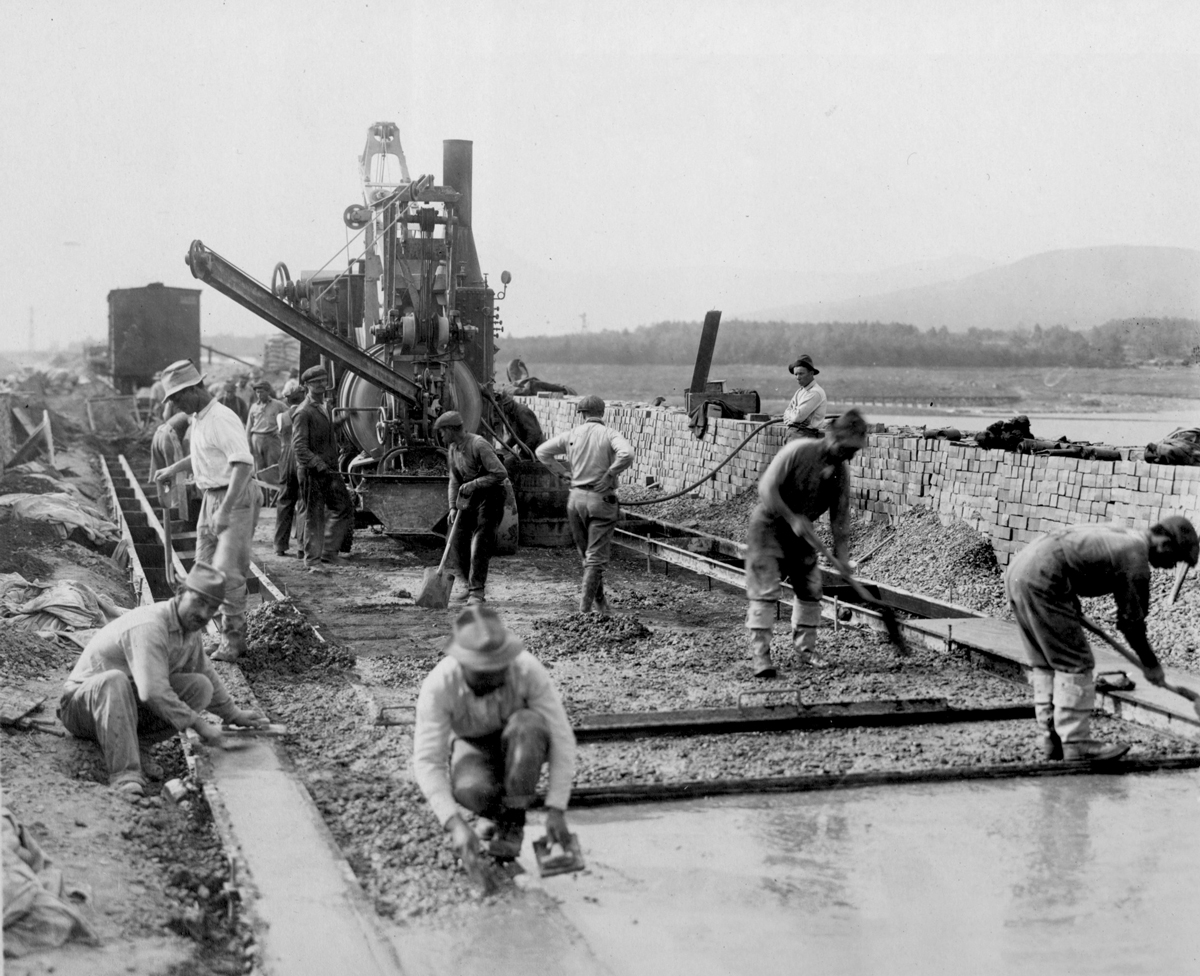
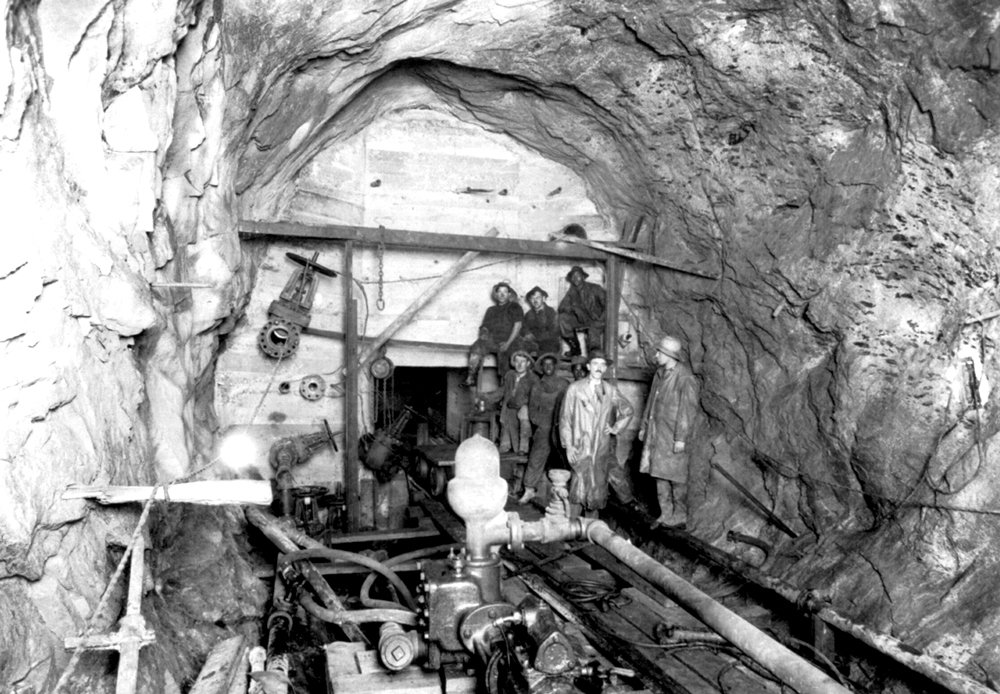
Water Labor
New immigrants made up the majority of the water infrastructure workforce, and they lived in camps, some with as many as 2,500 people. In keeping with the prejudices of the time, “Italian and black workers generally [occupied] separate quarters below the dam while white Americans lived separately.” –Board of Water Supply, Catskill Water Supply. Corralling workers’ waste before it contaminated local streams was one of the major unseen tasks of the waterworks project, and it employed hundreds more people. Eventually, though, waste in the camps became more controllable than waste from the Catskills neighbors, and project managers began to see Catskill residents as the biggest threat to the cleanliness of the drinking water supply.
![]() MORE
MORE
Waste in the Watercourse
In 1915, the city secured permission to enforce health and cleanliness standards over the Catskill residents. The resulting regulations created a buffer zone where nothing could be dumped or disposed of, and by the 1920s New York City was building waste treatment plants in the Catskill villages to protect its investment in the purity of mountain water. The campaign against pollution stemmed from the hefty price tag of a filtration plant. Rather than extract more revenue from city residents to build a filtration plant, the city sought to indefinitely defer filtration by imposing its police powers on watershed residents.
![]() MORE
MORE
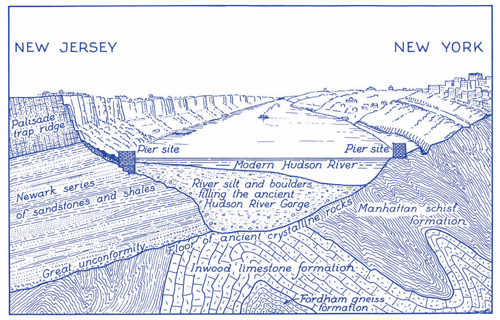
Under the Hudson
Devising a means to carry water beneath the Hudson River was the most challenging aspect of the Catskill aqueduct construction. Engineers identified the area around Storm King mountain, and began an arduous process (with many failed attempts) of boring into the earth below the riverbed to locate bedrock. The tunnel was eventually built 1,100 ft below ground, which included 950 ft below the Hudson River bedrock. This bedrock buffer between the tunnel and the river bottom allowed the aqueduct to withstand the colossal pressure exerted by the river.
![]() MORE
MORE
Removing Gilboa
Despite the expansive Catskill system and the 130.5 billion gallon holding capacity of the Ashokan Reservoir, New York City continued to search for ways to obtain more water. In 1917, New York City acquired the village of Gilboa and a surrounding area of 2,435 acres, and the Board of Water Supply gained permission to build a dam to create the Schoharie Reservoir over the village of Gilboa (until 2020, the town of Gilboa contained the oldest known fossil forest in the world). Water from the Schoharie Reservoir would enter the Shandaken Tunnel, travel through the Esopus Creek, and eventually join the Ashokan Reservoir. The Schoharie Reservoir forced the removal of 350 residents in Gilboa and neighboring valley lands.
![]() MORE
MORE
From the Supreme Court to the Delaware
Political precedent had changed since the consideration and subsequent scrapping of the Connecticut Housatonic River plan in the early 1900s. When the Schoharie Reservoir was complete, New York City’s daily water intake was rising to 42 million gallons, so the Board of Water Supply began to look into the development of the Delaware River and its tributaries. Despite state approval, the city’s plans to build five more reservoirs were challenged by New Jersey and Pennsylvania, which shared the interstate waters of the Delaware River. The dispute went to the U.S. Supreme Court, which in 1931 allowed New York City to take no more than 440 million gallons of water a day from the river system.
![]() MORE
MORE
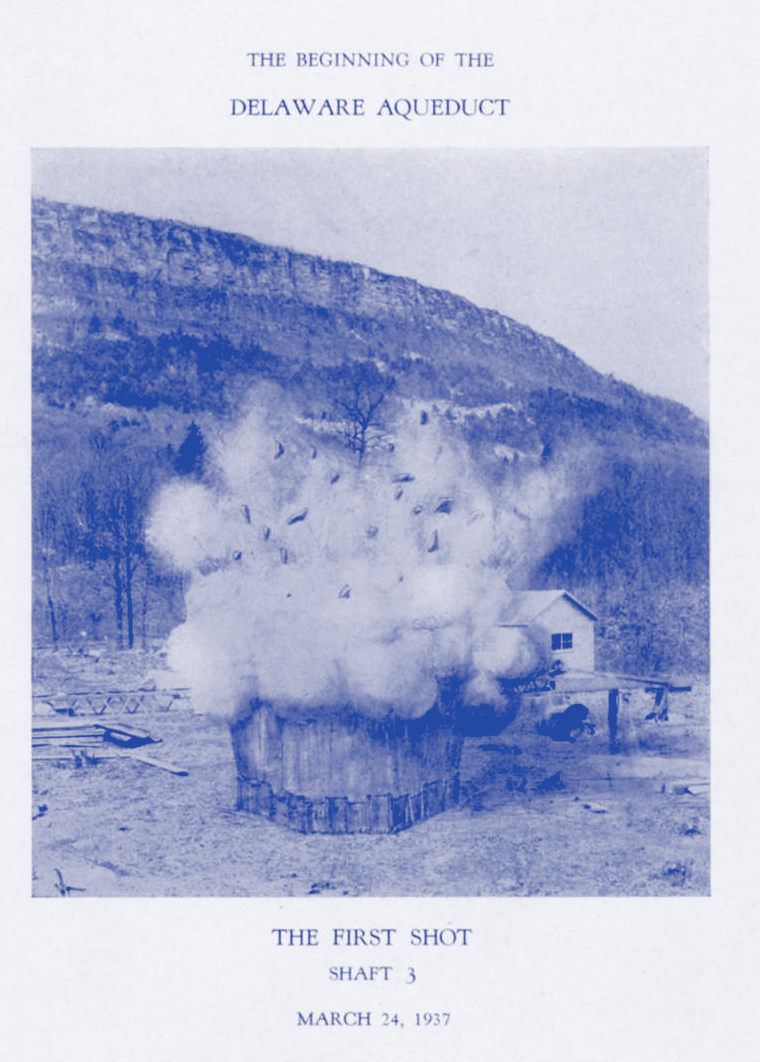
Tapping the Delaware River
After the Supreme Court ruling, New York City built four new reservoirs. Bounded by Ulster and Sullivan County, the Rondout Reservoir commenced building in 1937 and was in service by 1951. The communities of Eureka, Lackawack, and Montela were flooded. The Neversink Reservoir in Sullivan County was completed in 1953, and the hamlets of Neversink and Bittersweet were flooded. The city acquired more than 13,000 acres for the Pepacton Reservoir in Delaware County, which was completed in 1954. The 2,400-foot-long dam enclosed the largest of the reservoirs at eighteen miles long. The Pepacton displaced 974 people in the communities of Arena, Pepacton, Shavertown and Union Grove. Another Supreme Court case allowed the city to take additional water from the Delaware River. So, in 1965 the Cannonsville Reservoir was built and completed the Catskill/Delaware water system. This reservoir displaced an additional 941 people with the flooding of five more communities: Beerston, Cannonsville, Granton, Rock Royal, and Rock Rift.
![]() MORE
MORE
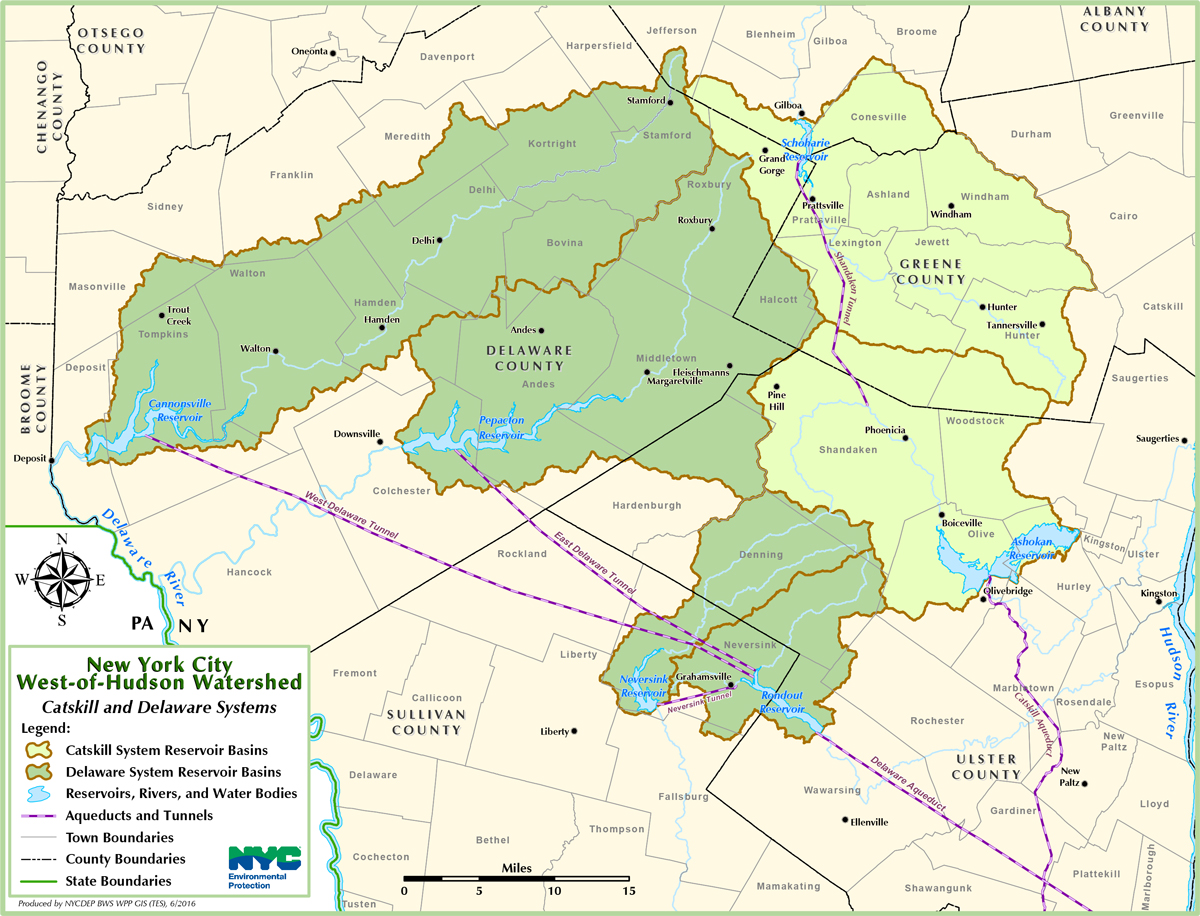
Aqueducts
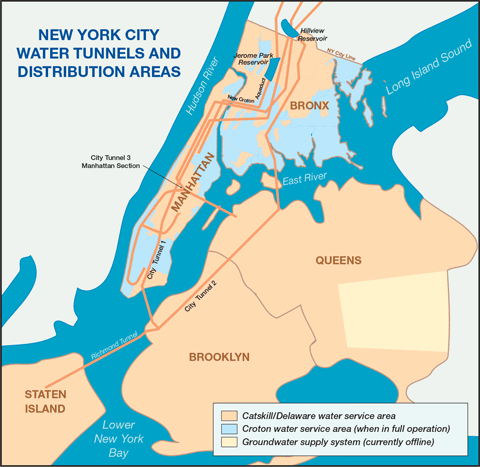
Water from the Pepacton, Neversink, and Cannonsville Reservoirs flows to the Rondout Reservoir by gravity via three tunnels, all together spanning 75 miles, and all significant infrastructure projects in themselves. The combined waters are then sent to the city in one of the world’s longest continuous underground tunnels, the Delaware Aqueduct, which bridges the span of 85 miles from the Rondout Reservoir, under the Hudson River, to Hillview Reservoir in Yonkers.
![]() MORE
MORE
The EPA
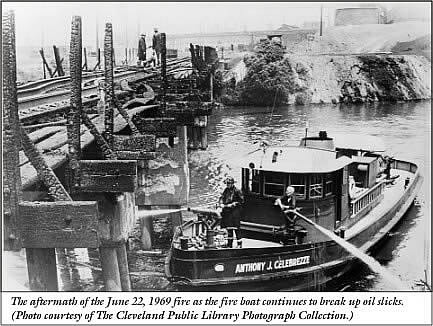
In the 1960s, large lakes in the U.S. that were used for drinking water had mounting pollution problems. Lake Erie began making national headlines with the oft repeated “Lake Erie is Dead” due to constant dead fish along its shoreline due to waste and pesticides. At the time, 11.6 million people lived in its basin, and it was standard practice for factories to dump chemical pollutants into the lake. On the Cuyahoga River in Ohio, a tributary of Lake Erie, an oil slick on the river caught fire in June of 1969. The blaze was quick lived before it was extinguished, but caused about $50,000 in damage to railroad bridges spanning the river. The next year, congress established the Environmental Protection Agency, for the first time creating a federal bureau to oversee pollution regulations. Later, in 1986, the EPA updated the Clean Water Act, which forced the New York City government to take a stricter stance on the rules and conduct in the Catskill watershed or face the high financial costs of building a filtration plant.
![]() MORE
MORE
The New York City Water Board
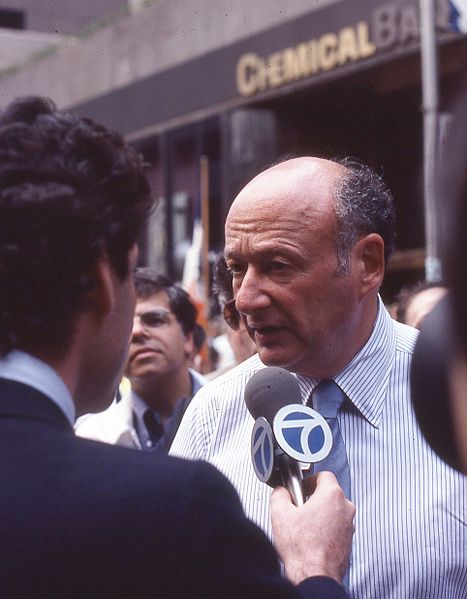
Until the 1970s, the city’s primary concern was meeting the city’s demand for water. However, capital investment in the water system collapsed during the fiscal crisis of 1975, and then again in the mid 1980s due in part to the city’s administrative changes with Mayor Ed Koch and a drop in federal and state funding towards the city’s budget. The drinking water system was falling into disrepair due to the aging pipes. At the same time, the EPA was beginning oversight on drinking water conditions, which were difficult to meet. To relieve pressure on the city’s budget, Koch created two semi-autonomous city agencies, the New York City Municipal Water Finance Authority and New York City Water Board. The Water Finance Authority sells bonds to pay for water projects, and the New York City Water Board sets water and sewer rates to the amount needed to pay back the bonds.
![]() MORE
MORE
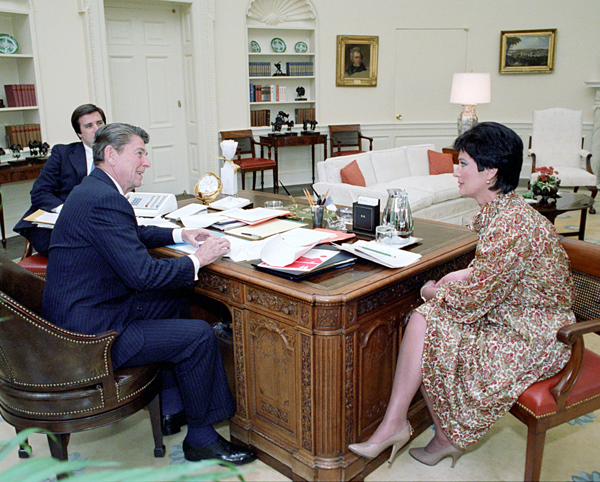
The Reagan Years
Since the election of the second Reagan administration in 1984, contributions of state and federal funding to the city’s budget declined. Political pressure to hold down property taxes since the 1970s caused an increase of water and sewer prices by 200% between 1987 and 1994. To put this in perspective with water infrastructure trends in the U.S. at the time, in 1977, the U.S. spent $76 per person to support public water; that figure now stands at less than $14 per person. In the late 1990s, 43 states had private water companies operating within them and almost 600 cities held a contract with a private water company. 20 cities had more than one private company operating within the city limits. At this time, following the trends of other large U.S. cities, new regulations allowed the city to shut off the water supply in individual buildings, which has since impacted cities’ low-income households.
“New York [City] was sort of this colossus that could do what it wanted to do. By the 1970s/80s that starts to change. And the real wake-up call comes in the late 80s, early 1990s when the federal government orders it to build a filtration plant. That’s this really significant moment where I think the story is before and after that point in time.” – David Soll, Author
![]() MORE
MORE
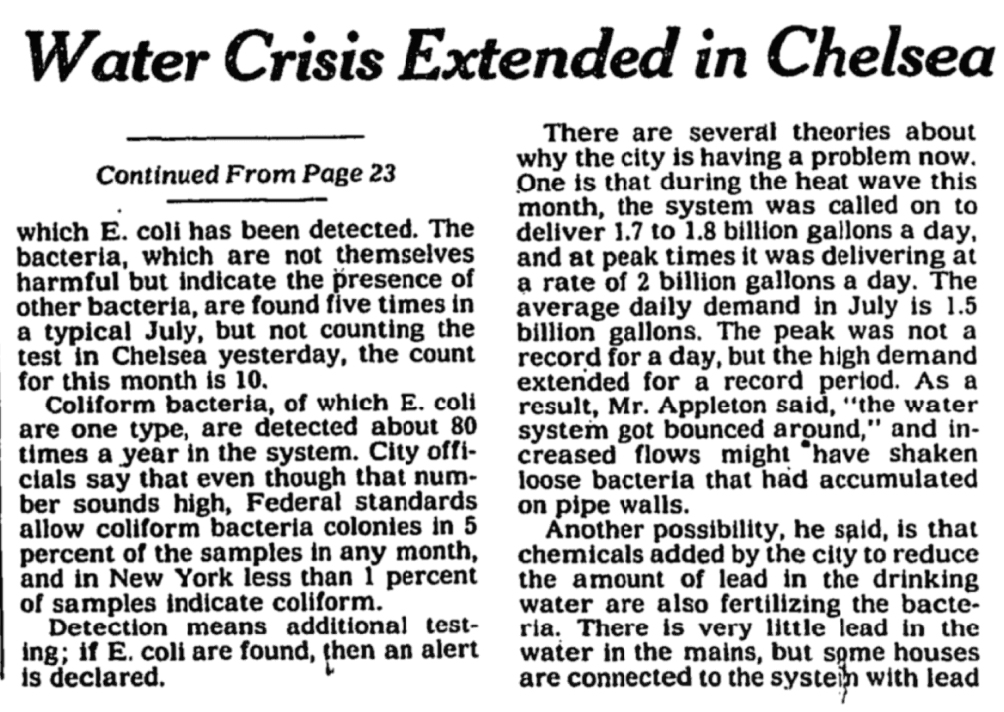
Contamination and Bottled Water
The quality of New York City’s unfiltered water, specifically the Croton systems, came into question in the early 1990s. The pipes were aging, and the once sparsely populated region was becoming more developed. Particular concerns revolved around chloride levels, which had risen 265% since 1960, and the discovery of E. Coli in tap water from Chelsea and the Lower East Side (both of which were served by the Croton reservoir). In response, the city issued a boil water warning, and sales of bottled water spiked. Interestingly, however, bottled water sales had been increasing in New York even before these health alerts. Bottled water consumption grew rapidly due not only to increased anxiety over water quality, but also to the successful marketing of mineral waters as a healthy choice, particularly for wealthier residents who were the main buyers of bottled water in New York City.
![]() MORE
MORE
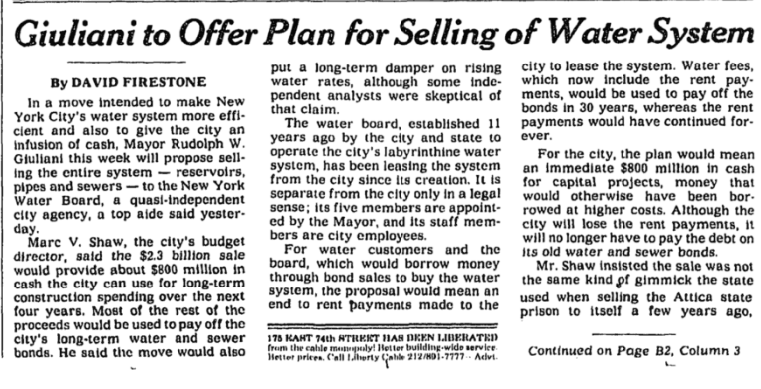
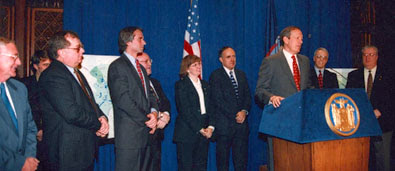
Alan Hevesi
In 1993, city Mayor Rudolph Giuliani instituted a range of cuts for social and environmental services. In May 1995, Mayor Giuliani announced his intention to sell off the entire water system to the New York City Water Board. Under the proposed deal, the city would receive $2.3 billion from the Water Board in exchange for the ownership of the entire water and sewer system. However, this attempt to find a short-term solution to the city’s growing budget deficit was blocked by the city comptroller and infamous former politician Alan Hevesi. Comptroller Hevesi rejected the idea of selling city infrastructure in order to reduce the current budget deficit as a ‘fiscal gimmick’ with detrimental long-term consequences for New York City (New York Times, 1995). Longer term, the loss of the water and sewer system would have accelerated the erosion of the city’s control of its watershed by making it easier for a New York State governor to change the composition of the city’s Water Board in favor of up-state development interests (the seven members are appointed by the city’s mayor). This would make the need for water filtration more likely in the Catskill-Delaware system, which would cost tens of billions of dollars (New York Times, 1995).
![]() MORE
MORE
DEP Watershed Regulations
In an attempt to avoid spending billions of dollars on a filtration plant, New York City’s Department of Environmental Protection issued stricter regulations on upstate communities in 1990. However, the city did not consult with Catskill residents, so the release of the new regulations prompted serious backlash. State Assemblyman Richard Coombe of Grahamsville said, “We cannot afford to let New York City buy more of our land and increase its control over the watershed without considering the economic impact these actions will have on our communities.” During this time, many different businesses and committees met to discuss how to push back against the regulations. In particular, farmers in the region argued that prohibiting farm activity within 100 feet of water would put them out of business. The Catskill residents put together the Coalition of Watershed Towns and hired a law firm. After several years of negotiations and heightened animosity, the two regions came to an agreement in 1995, in part thanks to new NYC DEP Commissioner, Marilyn Gelber, who frequently traveled upstate to listen to local representatives.
![]() MORE
MORE
1997 New York City Watershed Memorandum of Agreement
The city passed its watershed regulations in 1997 with the New York City Watershed Memorandum of Agreement. With it came a five year Filtration Avoidance Determination, which allowed the city time to prove that a filtration plant was unnecessary, and the ability to purchase 355,000 acres of land from willing sellers for full market value in the watershed. Upstate communities won the prohibition of property condemnation and received financial compensation for the extra costs of adhering to the new regulations. Some of the regulations included prohibiting septic tanks, fuel tanks, and impervious surfaces within 100 feet of water. Upstate communities were also allocated funds for environmentally minded economic development, which was to be run and developed by the new Catskill Watershed Corporation.
Between 1997 and 2011, nearly 1,400 landowners signed purchase contracts to sell 120,000 acres of land or easements at fair market value in the Catskill/Delaware and Croton watershed systems. The Land Acquisition Program, started in 1997, focused mostly on forested land in the Catskill and Delaware watersheds. Prior to the start of the Land Acquisition Program, the city had purchased 44,600 acres surrounding the reservoirs. New York State also owns and protects more than 200,000 acres of watershed lands.
![]() MORE
MORE
International Water Infrastructure Privatization, Part I
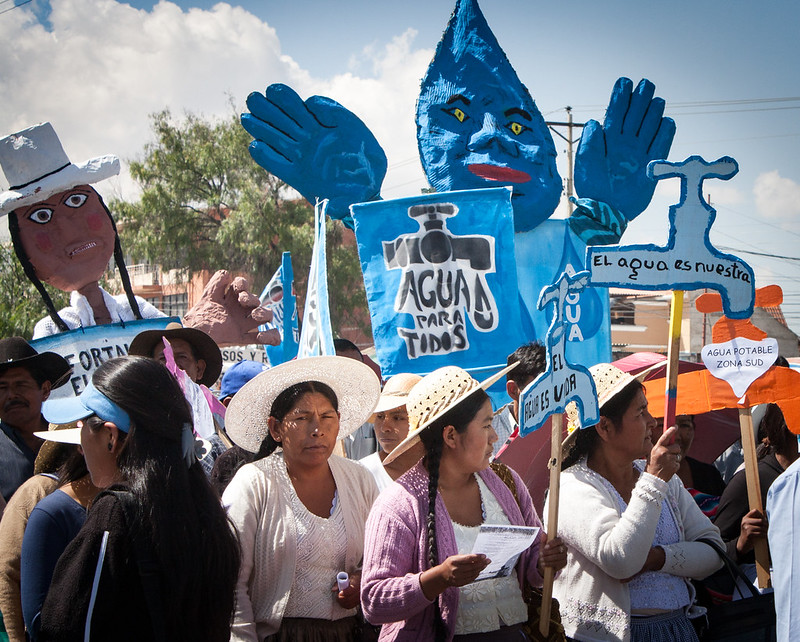
In 1996, The World Bank offered a $14 million loan to Cochabamba, Bolivia to expand their water system, under the condition that they privatize their water company. The San Francisco corporate giant, Bechtel, took control of Cochabamba’s water, and city residents saw their water rates go up by an average of 50%. The people of Cochabamba and their rural neighbors protested for months, shutting down the city with strikes and blockades on three separate occasions. Bolivia’s president sent armed troops and suspended constitutional rights, but in April, 2000, Bechtel lost its foothold in Bolivia. Not much later, the markets for drinking water infrastructure became publicly traded with exchange traded funds, like the S&P Global Water Index Fund (CGW on the NYSE trading at $41.7) and AllianzGI Global Water Fund (another ETF), which traded on the NASDAQ under AW-TAX currently at $17.66 a share. Ultimately, the Bolivian water revolt has had tremendous impact around the world and inspired similar movements.
![]() MORE
MORE
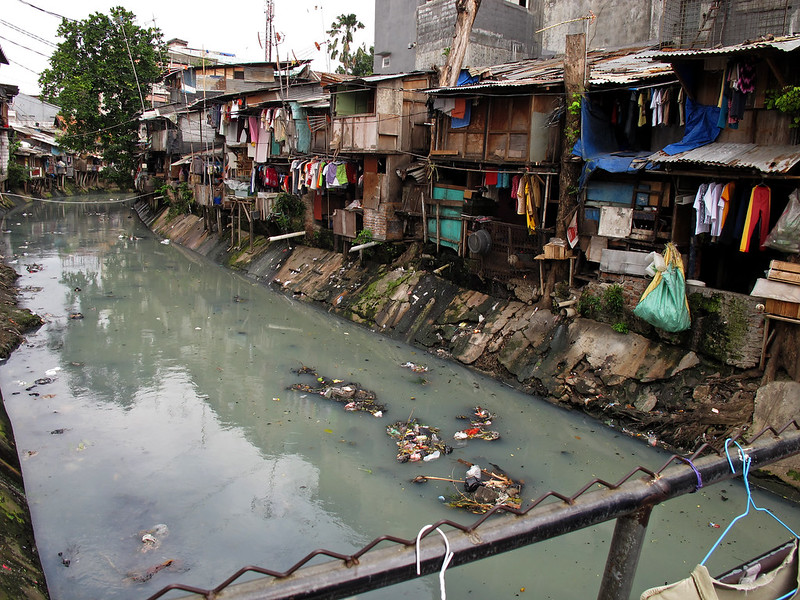
International Water Infrastructure Privatization, Part II
Additional protests around water privatization began happening in Asia, Africa, and other parts of South America. The Kyoto Water Forum in 2003 saw various strands of the water justice movement coming together to reject the commodification of water. Despite these advances, The Wall Street Transcript organized a conference in 2005 titled, “Profiting in the Water Industry: Tapping a reservoir of wealth.” The conference reported that in the U.S. alone the water industry was expected to grow to $150 billion before inflation (the World Bank estimated the global market of water services to be worth $800 billion). The announcement promised participants opportunities to discover investments and profitable niches in the $150 billion water industry.
![]() MORE
MORE
Mismanaged Water Infrastructure Privatization
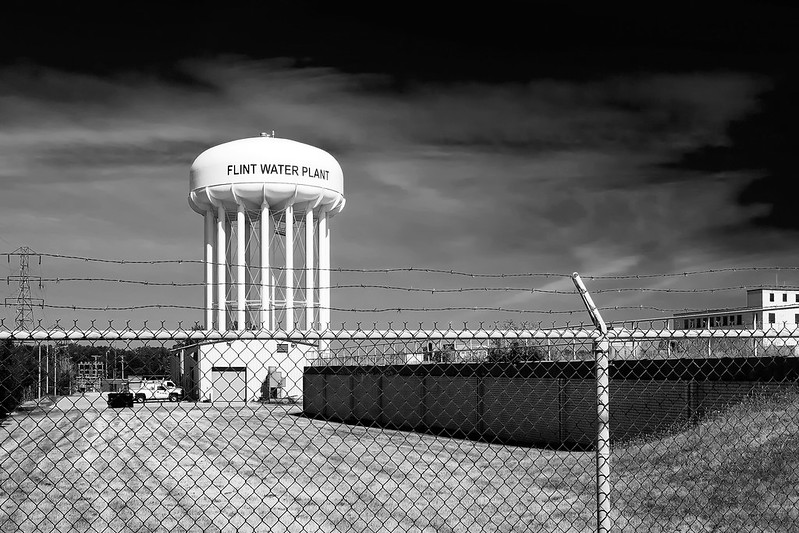
More recent effects of mismanaged privatization occurred across the country, where immediate solutions have involved bottled water, which has an estimated $350 billion dollar global industry by next year. In the past several years, cities including Newark and Detroit have advised residents to drink bottled water due to old pipes that leeched lead and copper into the tap water. Communities outside town limits across the U.S. are not connected to municipal water supplies, and they too often turn to bottled water as their well water is contaminated. In places such as Fairmead, CA, communities lack tap water because it has been used up by other sources, including agriculture and big cities. In Flint, MI, the city changed Flint’s water supply to the polluted and cheaper Flint River in order to save the city money. Instead of investing in long-term solutions, at times governments have relied on bottled water companies for quick fixes to pollution problems.
![]() MORE
MORE
The Water System Updates
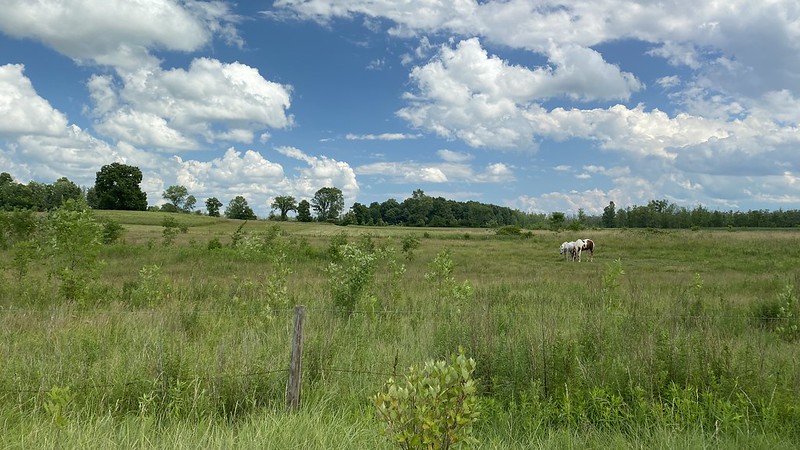
In 2008, 98.3% of New York City’s water came from the Catskill/Delaware system. The Croton system provided 1.7% of the daily supply to the City. New York City’s groundwater system in southeastern Queens was off-line for the entire 2008 calendar year. Today, 75% of the 2,000 square mile public and private watershed is covered by forests, and dislocation by eminent domain is no longer a concern. The system is now seen as one of the greatest modern successes in ecosystem services management in the United States and is modeled around the world. Although bitterness and animosity still linger, thoughtful partnerships with more balanced power dynamics have begun to change those relationships toward one of careful cooperation.
![]() MORE
MORE
Power Sharing and Participation, Part I
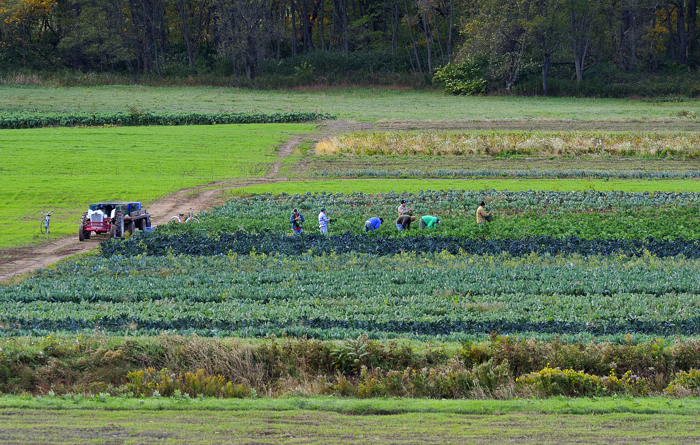
In 2008, 98.3% of New York City’s water came from As industrial agriculture was taking hold in much of rural United States in the early 2000s, programs were implemented between local and city governments along with residents to find mutually-beneficial ways of protecting both the watershed and the communities within. An eighteen month process worthy of a saga between farming communities in the Catskills and New York City officials led to an agreement: farmers would be financially compensated for voluntary ecological improvements that prevented animal and chemical waste from entering the water system. Additionally, the city would bear the cost of replacing or fixing residents’ septic tanks when needed, and forestry management practices would be put in place to ensure regeneration of critical forest land.
![]() MORE
MORE
Power Sharing and Participation, Part II
City officials believed the success of this program was due to both parties setting their particular goals. Both a clean drinking water supply for the city and the economic viability of Catskill farming were important, and both sides had to agree to commit to achieving both goals. They also believed that its success had to do with asking farmers to design most of the program themselves (based on local knowledge and supplemented by their own experts). The proposed program they designed in 2010 was called “Whole Farm Planning.” It incorporated environmental planning into the business strategy of the farm. Also groundbreaking was the insistence that all agencies had to agree to put aside their particular concerns and instead identify the contributions they could make to the program, or they could not participate.
![]() MORE
MORE
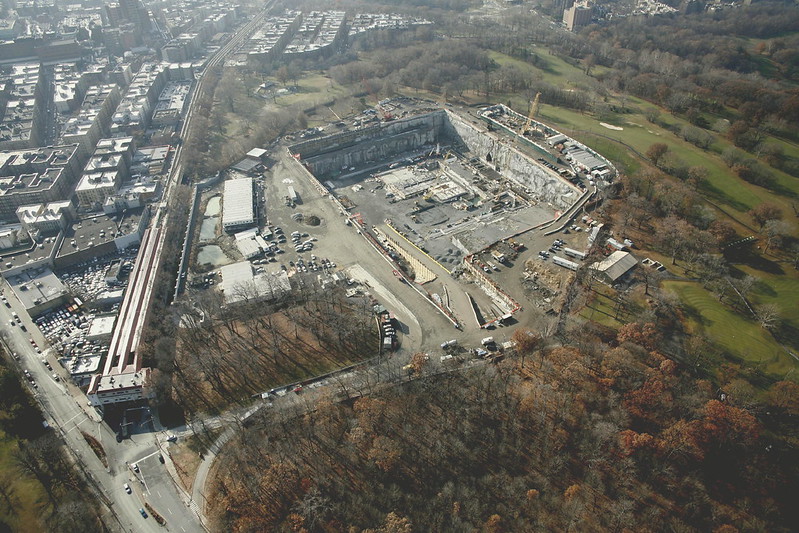
Filtration, Part I
Alongside Boston, San Francisco, Seattle and Portland, Oregon, New York City is one of five cities in the United States with a largely unfiltered water supply. Ten percent of the city’s water supply is currently filtered by a UV filtration plant that recently opened under Van Cortlandt Park in the Bronx. The plant treats water from the reservoirs surrounded by development in Westchester and Putnam counties. A team of scientists and engineers also work 24/7 alongside monitors to oversee the water quality throughout the watershed. The DEP must make sure the water is kept in pristine condition, which it does by fending off migratory birds from the reservoirs, fixing homeowner’s septic tanks, working with farmers to control manure runoff, and constantly trying to buy more land to prevent the area around the watershed from being paved and polluted.
![]() MORE
MORE
Filtration, Part II
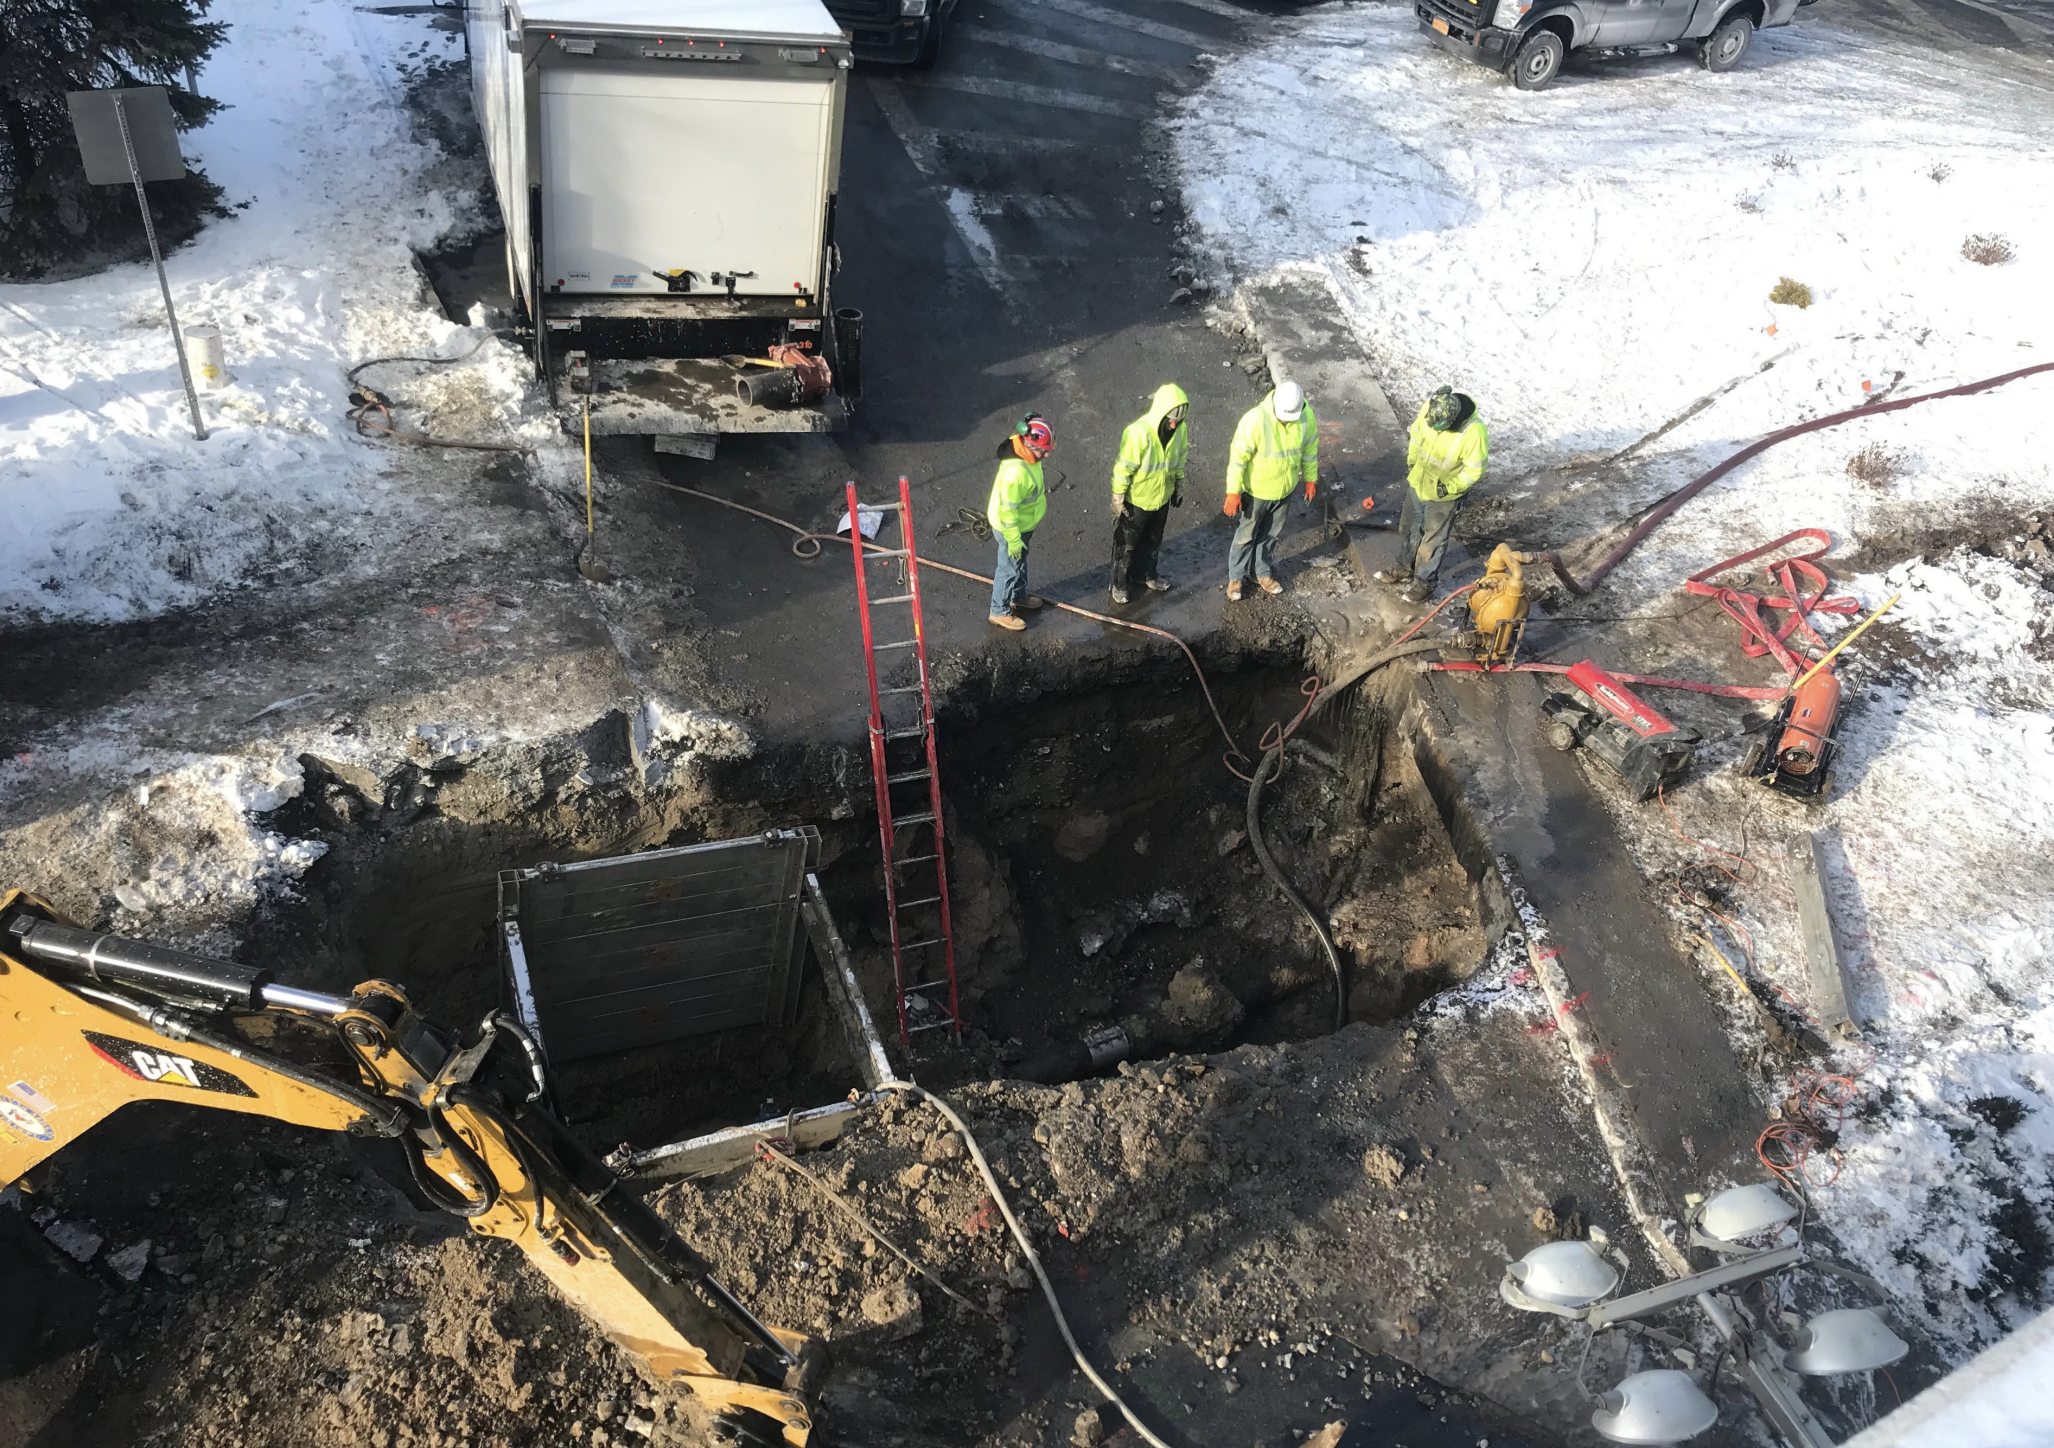
Given the size of the city, the New York City drinking water supply system has grown to be the largest unfiltered water supply in the United States and the largest surface water system in the world. Every day, it provides 1.2 billion gallons of high quality drinking water to nearly half of the population of New York State. Today, however, parts of New York City’s drinking water infrastructure are over 100 years old. The failure to maintain this basic service has created a massive backlog of repairs and upgrades. Governor Cuomo’s proposed $400 million five year annual budget for water projects barely put a dent in what is needed. Across New York State, urgency is mounting as water main breaks flood neighborhoods, sewage overflows discharge untreated waste into waterways, failing septic systems pollute land and waterways, and pipes leach lead. However, the Food and Water Watch states, “A 2009 study by the Clean Water Council estimated that every $1 billion spent on water infrastructure could create between 20,000 and 27,000 jobs across the economy. Governor Cuomo and the legislature could promote safe water and clean energy by creating jobs laying water pipelines instead of fossil fuel pipelines.”
![]() MORE
MORE
The Present, Part I
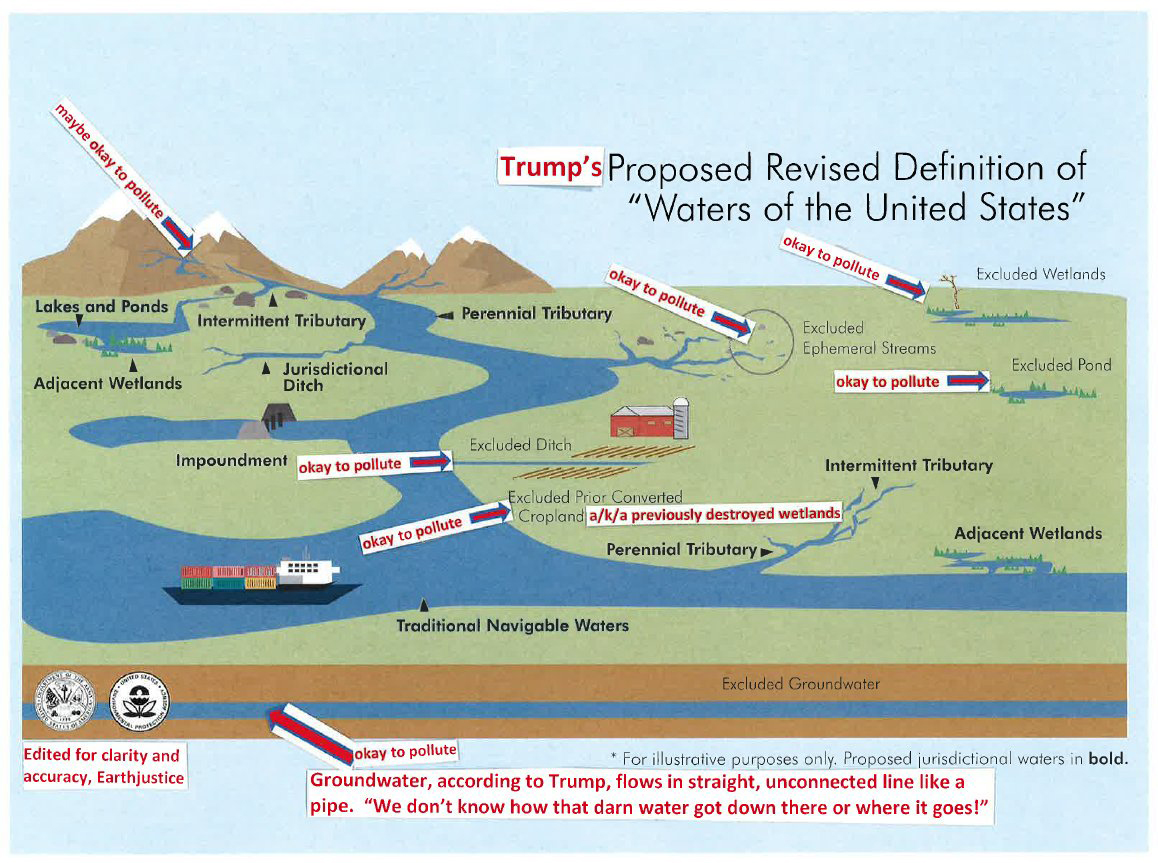
The Trump administration had pushed for economic growth no matter the human and ecological cost. In the early summer of 2020, then EPA Administrator Andrew Wheeler announced that they were following through on President Trump’s executive order to curb “abuses of the Clean Water Act that have held our nation’s energy infrastructure projects hostage, and put in place clear guidelines that finally give these projects a path forward’’ (New York Times). Jon Devine, director of federal water policy at the Natural Resources Defense Council, replied that the Trump administration’s Clean Water Act rollbacks guts states’ and tribes’ authority to safeguard their waters. The consequences of industrialization’s material aspects are present in human-caused environmental catastrophes, from epic extinctions to rapid erosion, exploited soils, contaminated water, and debased forests leading to desertification, climate change, and habitat collapse. Trump’s executive order against the Clean Water Act adds to the long list of environmental damage done for the sake of capital accumulation.
Contrary to the national agenda, New York City is working to protect the harbor through green infrastructure initiatives that combat stormwater runoff and combined sewer overflow (CSO), both of which carry pollutants into local waterways. New York City has implemented green infrastructure throughout Brooklyn, Queens, the Bronx, and some parts of Manhattan with the goal of reducing CSO by 1.67 billion gallons per year by 2030. In addition to green infrastructure, the DEP also has a long term plan for protecting our local wetlands and Jamaica Bay.
![]() MORE
MORE
The Present, Part II
For generations, New York City residents have been able to access their water supply without a sense of the back story. There were (and still are) mounting hardships and sacrifices that residents in the watershed face, while massive public works projects spanning over a century have allowed city residents and visitors access to this healthy, clean resource. Even with the financial assistance the city provides, watershed communities are often unseen stewards who hold the responsibility of protecting the city’s water supply. Like any public system, New York City’s drinking water needs support from all of its more than eight million users. Learning from the rich and intricate complexity that is New York City’s public drinking water system and treating public space like a commons with stakeholders, stewards, and allies is integral for it to thrive and be a more just system.
![]() MORE
MORE